Home / Course / Data Analytics Training in Pune Live Classes, Real Projects
Data Analytics Course in Pune: Live Classes, Real Projects & Placement Support
If you spend your days building Excel reports and wondering what comes next, or you are about to graduate and want a skill employers are looking for, this data analytics course in Pune is built for you. Over six months of live Saturday and Sunday classes, you go from Advanced Excel to Power BI, SQL Server and Python, with ChatGPT, Copilot and Claude woven in. You finish with real MIS and dashboard projects, a certificate recruiters can verify online, and placement support.
Attend offline at our Shivajinagar centre or join online from anywhere. You absolutely do not need a coding background!
- 6 months of live, instructor-led training
- Hybrid classes in English and Hindi
- Real MIS and dashboard projects
- 0% EMI, so you can pay in easy instalments
- Recorded sessions and doubt support for 1 year
India's Leading Public Speaking Institute
-->
Free Counselling Session
Talk to our expert advisor and discover the right roadmap for your communication & personality growth.
- Personalized Career Guidance
- Confidence Building Roadmap
- Public Speaking Strategy Session
- Course Recommendation by Experts
Request a Call Back
Fill the form below and our team will contact you shortly.
Investors who believe in us




Enrol in Data Skill Hub’s Data Analyst Mentorship Program in Pune to gain the skills and confidence essential for a successful career in data analytics.
Every major company in Pune, from TCS and Infosys to Bajaj and KPMG, runs on data. The demand for skilled data analysts is high. Have a successful career with our comprehensive data analyst training classes that cover the latest tools and technologies, including Advanced Excel, Power Query, Power BI, SQL, Python, and Generative AI. We make sure that you get ready for the modern business intelligence environment.
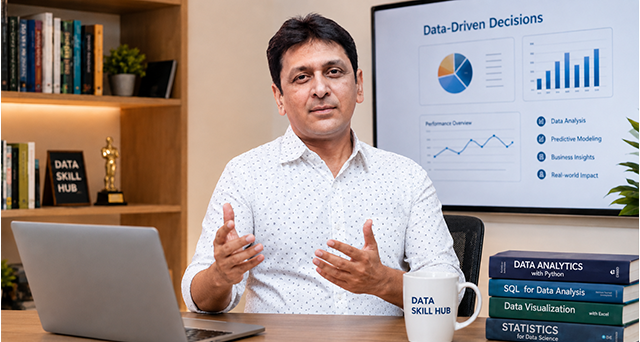
At Data Skill Hub, we provide the most structured, live, and practical courses built for people who want to work with data professionally. You will gain the real expertise to solve real-world business challenges under our expert trainer, Mohammed Shabbir. We are highly focused on hands-on training with real MIS and dashboard projects so that you can build practical experience alongside strong theoretical foundations.
Join our data analyst course in Pune with hybrid classes (offline in Hinjewadi, Viman Nagar, Kothrud, etc or online from anywhere) and take your first steps towards becoming a job-ready data analyst.
Data Analytics Course in Pune at a Glance
Every company in Pune, from IT services to manufacturing and consulting, runs on data, and people who can turn it into decisions are in demand. Here is the program in one view.

Course Name | Certified Data Analytics Mentorship Program |
|---|---|
Duration | 6 months, about 200 hours |
Schedule | Live classes every Saturday and Sunday |
Mode | Hybrid: offline in Pune or online from anywhere |
Language | English and Hindi |
Missed a class? | Watch the recording |
Support | Doubt support on WhatsApp and trainer email, 9 AM to 9 PM, plus 1 year of recorded access |
Community | WhatsApp group, community forum, and 125+ free lectures on YouTube |
What’s Included in Our Data Analytics Training in Pune (Excel to Python)
The program covers the complete analytics workflow, from messy raw data to a dashboard your manager can read in a minute. You get an 8-course bundle:
India's Leading Data Skill Institute
-->
Free Counselling Session
Talk to our expert advisor and discover the right roadmap for your communication & personality growth.
- Personalized Career Guidance
- Confidence Building Roadmap
- Public Speaking Strategy Session
- Course Recommendation by Experts
Request a Call Back
Fill the form below and our team will contact you shortly.
Not ready for the full program? You can start with the Advanced Excel Course in Pune or the Power BI Course in Pune. Both are part of this program, so you can upgrade anytime.
Data Analyst Course in Pune: Syllabus
The curriculum follows what companies in Pune and across India use every day. Every course ends with hands-on work, and AI tools are used across all modules.
Advanced Excel
Fifteen modules take you from shortcuts and data cleaning to the functions analysts live in: text, date and logical functions, VLOOKUP, INDEX MATCH and XLOOKUP, and SUMIFS and COUNTIFS. We then move to Office 365 functions (FILTER, SORT, UNIQUE, TEXTSPLIT), PivotTables, slicers, dynamic arrays, and charts with conditional formatting. You finish by building an interactive dashboard and recording your first macro.
Power Query & Power Pivot
With 11 modules, you learn to get data into shape. You connect to Excel, CSV, PDF and web sources, merge and append multiple files, profile your data, and transform it with unpivot, conditional columns, date operations and basic M code. Case studies include commodity price, sales, attendance and survey analysis.

Power BI
This is the heart of the program and has 17 modules. You learn data modelling with star schema, then DAX for columns, tables and measures, including CALCULATE, time intelligence (YTD, MTD, YOY, rolling averages) and variables. You build more than 20 visual types with formatting, drill-through, bookmarks and tooltips.
SQL Server
You learn SQL Server in 16 modules that start with installing SSMS and designing a database, and end with interview preparation on a real HR database. You write SELECT, filtering, GROUP BY and CASE queries, work with subqueries and keys, and practise every join type (inner, left, right, full outer and self).

Python
If you have never coded, don’t worry! These 14 modules help you set up Anaconda and Jupyter, learn Python basics and data structures, then work with Pandas, NumPy, Matplotlib and Seaborn. You clean data, handle missing values, do exploratory analysis, calculate correlation and covariance, and automate scripts with a BAT file.
Bonus: VBA, Tableau & PowerPoint
Excel VBA covers macros, loops, user forms, error handling and automating daily reports. Tableau covers charts, calculated fields, dashboards, stories, parameters and maps. PowerPoint covers design principles, master slides, data visualisation and building a business-ready deck.
Data Analyst Course in Pune: Syllabus
The curriculum follows what companies in Pune and across India use every day. Every course ends with hands-on work, and AI tools are used across all modules.
Advanced Excel
Module 1: Essentials – Navigation, worksheet basics, all important shortcut keys.
Module 2: Data Cleaning – Text to Column, Flash Fill, Remove Duplicates, Find Unique, Trim.
Module 3: Text Functions – LEFT, RIGHT, SUBSTITUTE, REPLACE.
Module 4: Date & Time Functions – NETWORKDAYS, WORKDAYS, Time difference, Date difference, Ageing calculation.
Module 5: Lookup Functions – VLOOKUP, 2D VLOOKUP, VLOOKUP with MATCH, INDEX MATCH, XLOOKUP, Duplicate lookup, Multiple lookup.
Module 6: Logical Functions – IF, IFERROR, AND, OR.
Module 7: O365 Functions – FILTER, SORT, UNIQUE, TEXTSPLIT.
Module 8: Data Tools – Filter, Sort, Data Validation.
Module 9: Summarisation – SUMIFS, COUNTIFS, AVERAGEIFS, MAXIFS, MINIFS.
Module 10: Advanced Pivot – PivotTables, calculated fields, slicers, pivot charts.
Module 11: Array Functions – Dynamic arrays and legacy arrays.
Module 12: Visualisation – Charts, Conditional Formatting, Sparklines.
Module 13: Dashboard – Create an interactive dashboard using Pivot Charts & Slicers.
Module 14: Protection & Hyperlink – Sheet/cell protection, hyperlinks.
Module 15: Macros – Record Macro, understanding basic VBA.
Power Query & Power Pivot
Module 1: Introduction – User Interface, Load vs Unload, basic navigation.
Module 2: Data Sources – Connect to Excel, CSV, PDF, Web pages.
Module 3: Combine Data – Merge multiple sheets, merge multiple files, Append data, Fuzzy match.
Module 4: Data Profiling – Data Type, Column Profile, Column Quality, Column Distribution.
Module 5: Data Transformation – Remove blank rows, remove duplicates, merge columns, fill down, text functions, remove other columns, keep rows, remove/replace errors, promote headers, group by, format columns.
Module 6: Column Operations – Pivot column, unpivot column, add custom column, add conditional column, column from example, index column, split column.
Module 7: Date Operations – Extract Year/Month/Day, create Financial Year, Auto Calendar, add parameters.
Module 8: Load Options – Load as Table, Load as Pivot, Only Connection, Add to Data Model, Duplicate & Reference Query.
Module 9: M Language – Power Query M Code basics, Advanced Editor, List, Record.
Module 10: Complex Scenarios – Handle inconsistent headers, dynamic columns and rows.
Module 11: Case Studies – Commodity Price Analysis, Sales Analysis, Attendance & Survey Analysis.
Power BI Desktop & Service
Module 1: Introduction – Power BI UI, file types (.pbix, .pbit).
Module 2: Data Sources – Connect to Excel, CSV, SQL Server, PDF, Web, SharePoint, Folder.
Module 3: Power Query – Complete ETL features (same as Power Query module above).
Module 4: Data Modelling – Manage relationships, Active vs Inactive, Star schema, Fact & Dimension tables.
Module 5: DAX – New Column – Multiply, Addition, IF, SWITCH, DATEDIFF, RELATED, USERELATIONSHIP.
Module 6: DAX – New Table – CALENDARAUTO, Financial Year table, SUMMARIZE, FILTER, GENERATE SERIES.
Module 7: DAX – New Measure – CALCULATE, FILTER, ALL, ALLSELECTED, HASONEFILTER, SAMEPERIODLASTYEAR, DATEADD, DATESINPERIOD, DATESBETWEEN, LASTDATE, FIRSTDATE, MINX, MAXX, SUMX, DISTINCTCOUNT, COUNTROWS, Variables in DAX.
Module 8: Quick Measures – Time Intelligence, YOY percentage, Running Total, MTD, YTD, Rolling Average.
Module 9: Visual Calculations – Create Moving Average directly on visuals.
Module 10: Data Visualisation – Column charts, Line charts, Pie charts, Table, Matrix, Donut, Tree map, Bubble Map, Filled Map, Single Card, Multi Row Card, Slicer, Funnel, Scatter plot, Word Cloud, Combo Chart, Histogram, Ribbon chart, Stacked Bar, Waterfall, Decomposition Tree, Smart Narrative, Q&A visual.
Module 11: Formatting – Page formatting, visual formatting, conditional formatting (fx), custom themes.
Module 12: Interactivity – Drill up/down, single point drill, edit interactions (Highlight/Filter/None), filters (Visual/Page/Report level), create groups (Bins & List), Drillthrough, Bookmarks, Tooltip with charts, Top/Bottom N, Sync slicers, Add buttons and images.
Module 13: Analytics – Average line, Constant line, Trend line.
Module 14: Advanced Features – Small multiple, Image card, Image slicer.
Module 15: Power BI Service – UI overview, create workspaces, add users, assign roles, understand DATASET, create DATAFLOW, publish reports, create RLS (Static & Dynamic), Lineage view, create dashboards from multiple reports, dashboard tiles.
Module 16: Scheduling & Sharing – Personal gateway, schedule refresh, set alerts, export to PDF/Excel/PPT, share via link/Outlook/Teams, create mobile layout, view on mobile app.
Module 17: Practice Datasets – Sales (E-commerce), Financial, HR, Car Type, Customer Satisfaction, Social Media, Population Survey (any 3).
SQL Server
Module 1: Setup – Installation, SSMS setup and configuration.
Module 2: Database Design – Create database, design tables, establish relationships.
Module 3: SQL Commands – DQL (SELECT), DDL (CREATE/ALTER/DROP), DML (INSERT/UPDATE/DELETE), DCL (GRANT/REVOKE).
Module 4: Basics – Clauses, Operators, Data Types, Constraints, Regexp patterns.
Module 5: Filtering – WHERE clause, HAVING clause, ORDER BY, TOP N, DISTINCT.
Module 6: Functions – Text functions (CONCAT, SUBSTRING), Date functions (GETDATE, DATEDIFF), Aggregate functions (SUM, AVG, COUNT, MIN, MAX).
Module 7: Single Table Queries – Extract and analyse data from one table.
Module 8: Multiple Tables – Extract and combine data from multiple tables.
Module 9: DML Operations – INSERT new records, UPDATE existing records, DELETE records.
Module 10: DDL Operations – CREATE tables/views, ALTER structure, DROP objects.
Module 11: Conditional Logic – Logical columns using IF, CASE statements.
Module 12: Summarisation – GROUP BY aggregations, UNION, INTERSECT, EXCEPT.
Module 13: Subqueries – Nested queries, correlated subqueries, EXISTS.
Module 14: Keys – Primary Key, Foreign Key, Unique Key.
Module 15: Joins – LEFT JOIN, RIGHT JOIN, INNER JOIN, FULL OUTER JOIN, SELF JOIN.
Module 16: Interview Preparation – Solve real interview questions using the HR Database.
Python for Data Analysis
Module 1: Setup – Install Anaconda, Python, Jupyter Notebook.
Module 2: Environment – Create and manage virtual environments.
Module 3: Libraries – Install and import Pandas, NumPy, Seaborn, Matplotlib.
Module 4: Python Basics – Variables, Data types (int, float, string, bool), Operators, Statements
Module 5: Data Structures – Lists, Tuples, Sets, Dictionaries – creation and manipulation.
Module 6: Control Flow – For loops, While loops, If/Elif/Else conditions.
Module 7: File Handling – Read and write Excel files, CSV files.
Module 8: DataFrames – Create DataFrames, join multiple tables, export to files.
Module 9: Data Manipulation – Manipulate DataFrames (add/delete columns, filter rows), handle errors and exceptions.
Module 10: Filtering & Sorting – Filter data with conditions, order data, set indexes, and group by operations.
Module 11: Exploratory Data Analysis – EDA using Pandas & Matplotlib – summary statistics, distributions.
Module 12: Data Cleaning – Handle duplicate records, handle null/missing values, split columns.
Module 13: Statistics – Calculate correlation and covariance between variables.
Module 14: Automation – Create a BAT file to run Python scripts automatically.
Excel VBA Macro (Bonus)
Module 1: Recording Macros – Record, save, and run macros.
Module 2: VBA Editor – Understanding the editor interface (Project Explorer, Properties, Code window).
Module 3: Variables & Data Types – Declare variables, data types (String, Integer, Double, Boolean).
Module 4: Loops & Conditions – For loop, For Each loop, Do While loop, If-Then-Else, Select Case.
Module 5: User Forms – Create forms with buttons, text boxes, and dropdowns.
Module 6: Error Handling – On Error statements, debugging techniques.
Module 7: Automation – Automate daily Excel reports and repetitive tasks.
Tableau - Data Storytelling (Bonus)
Module 1: Interface – Connect to data sources, worksheet navigation.
Module 2: Basic Charts – Bar charts, line charts, pie charts, scatter plots.
Module 3: Calculated Fields – Create custom calculations and formulas.
Module 4: Dashboards – Build interactive dashboards.
Module 5: Stories – Create data stories with multiple sheets.
Module 6: Filters & Parameters – Add filters, create parameters for user input.
Module 7: Maps & Analytics – Build geographic maps, add trend lines and forecasts.
PowerPoint Presentation (Bonus)
Module 1: Design Principles – Colour theory, font selection, visual hierarchy.
Module 2: Slide Layout – Master slides, layout templates, consistent structure.
Module 3: Data Visualisation – Present charts, graphs, and tables effectively.
Module 4: Animations – Professional animations and transitions.
Module 5: Professional Deck – Create business-ready presentations.
AI Integration Across All Modules – ChatGPT, Copilot, Claude, etc.
15+ Tools you will learn
Excel
Power Query
Power Bi
Power Point
Mysql
jupyter

Pandas

Py Charm

ChatGPT

Claude

Copilot

DAX
Python

Sql Server

tableau



Who Can Join Our Data Analytics Classes in Pune?
These data analyst classes in Pune are not just for IT people. The program is designed for absolute beginners, so you do not need coding or a technical background. You need a laptop, basic comfort with numbers and the willingness to practise.

Working professionals (Non-IT)
In sales, HR, operations or admin? Learn to build the reports and dashboards your team currently begs someone else for.

College students
Use your weekends to add a skill your degree did not teach you, and graduate with projects to show in interviews.

IT professionals and developers
Add the business-intelligence side to your technical skills: DAX, Power BI Service and analytics storytelling.

Career changers
Moving into analytics from another field? Weekend batches let you learn without leaving your current job.

Marketing and Finance professionals
Turn campaign numbers and financial data into clear dashboards and forecasts that decision-makers read.

Freelancers
Offer reporting, dashboard and automation services to clients with a stronger toolkit.

Entrepreneurs and business owners
Stop guessing. Track sales, costs and customers in numbers you understand and trust.

MIS and Excel professionals
Already good at Excel? Move up to Power Query, Power BI, SQL and Python, and automate the work you do by hand today.
Why Choose Data Skill Hub as Your Data Analytics Institute in Pune?
When you compare data analytics institutes in Pune, look at what you actually get: live teaching, real projects, the tools employers use, and support after class. Here is what we offer.

Live and Practical Sessions
Every session is live, taught by an expert mentor in small batches, so you get personal attention. You build skills by doing them.
Real-World Projects
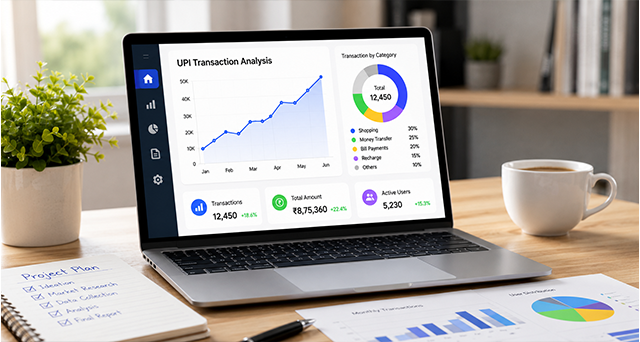
Each module comes with a hands-on project based on business scenarios, so you are job-ready, not just course-complete.

Bilingual Teaching
Learn in English or Hindi, whichever helps you understand better.
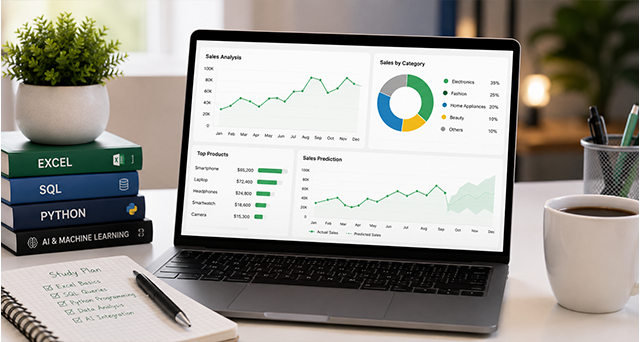
Comprehensive Curriculum
Excel, Power Query, Power BI, SQL, Python, VBA, Tableau and PowerPoint, with AI integration, in one program.
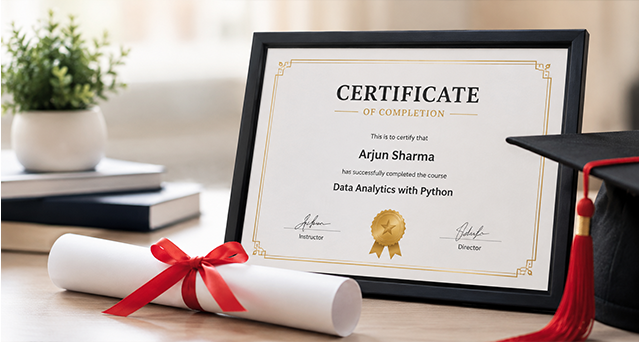
Recognised Certificate
A Data Skill Hub certificate on completion, verifiable online, to strengthen your resume and portfolio.
Industry Expert Mentor
Learn directly from Mohammed Shabbir, founder of Data Skill Hub, a Microsoft Certified Trainer with 13+ years of industry experience.

One-Year Support
Get 1 year of recorded session access and doubt support, so you can revise anytime, from anywhere.

Future Skills
AI and ChatGPT are part of the curriculum, so you are ready for how analysts work now.
Why is Data Skill Hub One of the Best Institutes for Data Analytics Training in Pune?
When you complete the Certified Data Analytics Mentorship Program at Data Skill Hub,
you do not just walk away with the knowledge. You will also get an industry-certified, industry-recognised certification. Our certificate is well recognised in Pune’s competitive market.
Feature | Data Skill Hub | Typical short courses |
Batch size | Small | Large, often unlimited |
Total hours | 200 hours | Often 20 to 30 hours |
Live practical training | Every session live | Often recorded or theory-heavy |
Trainer | Mohammed Shabbir (13+ years of industry experience) | Varies |
Tool coverage | Excel + SQL + Power BI + Python | Often 1 to 2 tools |
Placement support | Resume, mock interviews, LinkedIn, job alerts | Limited or none |
AI integration | ChatGPT, Copilot, Claude | Rarely covered |
Recorded access | 1 year | Often shorter |
Free demo | Before you enrol | Rarely offered |
Real projects | Yes | Often no |

Meet Your Data Analytics Mentor - Mohammed Shabbir
Mohammed Shabbir is the founder of Data Skill Hub and the lead instructor for every program. He is a Microsoft Certified Trainer and Microsoft Data Analyst with13+ years of industry experience in corporate reporting, MIS automation and dashboard development. He has worked with IBM, WNS and TomTom India Private Limited, among others, and brings those real business scenarios into every session.
He has trained 2,500+ students in India, and his 125+ free lectures on YouTube have built a community of 2,000+ subscribers. His teaching style is simple: plain explanations, real business problems and plenty of hands-on practice.
Students often mention his patience with doubts and his everyday examples, which you will see in the reviews below.
- Students Trained: 1000+ professionals
- YouTube Subscribers: 2,000+ with 125+ free lectures
- Teaching Style: Simple explanations, real business scenarios, hands-on practical approach
Data Analytics Course in Pune with Placement Support
We help you get interview-ready and in front of employers. After you complete your projects, you get:
- Resume building that highlights your projects and tools
- Mock interviews with real analytics questions
- LinkedIn profile optimisation so recruiters can find you
- Job alerts and referrals when openings match your profile
What we do not promise: a guaranteed job, a fixed salary or a set number of interviews. Hiring depends on your skills, your projects and the market. Our job is to make you well prepared, and the support is real.
After this course you can apply for roles such as Data Analyst, Business Analyst, Power BI Developer, MIS Executive, Operations Analyst, Marketing Analyst, Financial Analyst and BI Analyst.
Get access to 10+ skilling courses
Expert-taught Courses like:
- Power BI Expert
- Power Query + Power Pivot
- SQL Server
- Python for Data Analysis
- Excel VBA Macro
- Power Point Presentation

Data Analytics Certification in Pune
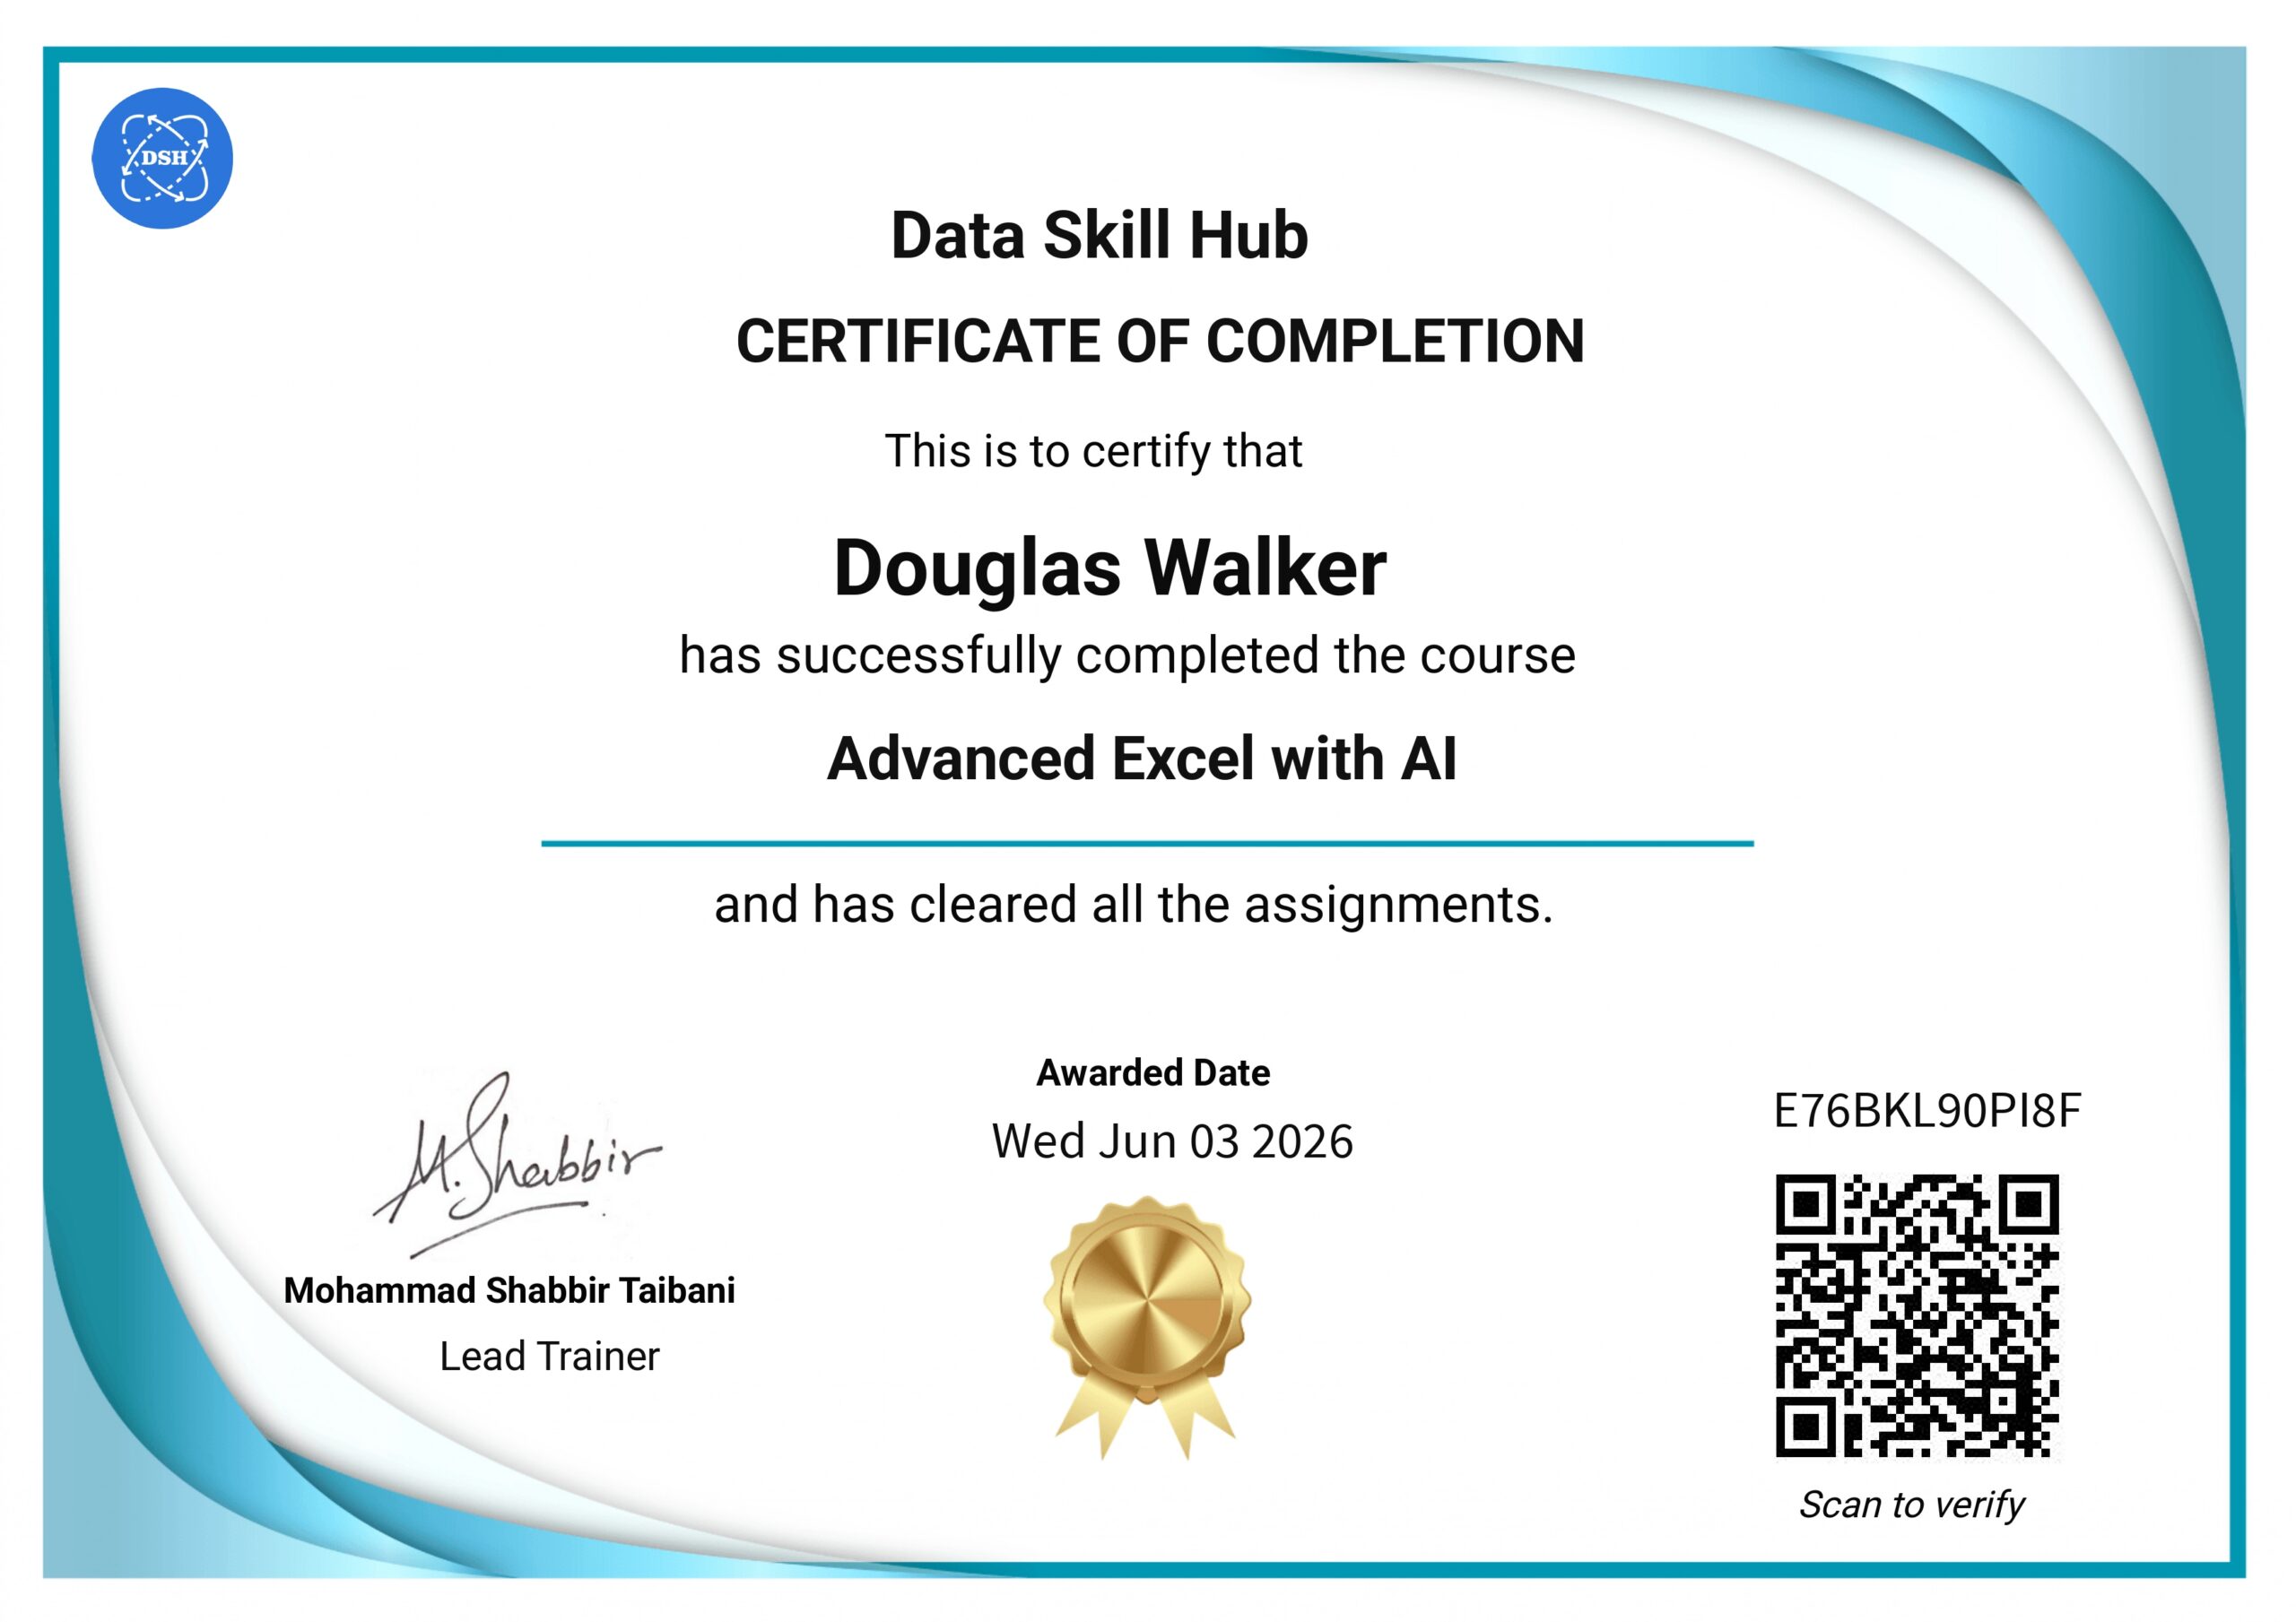
On completing all modules and submitting your final projects, you receive the Data Skill Hub certificate. Anyone, including a recruiter, can verify it on our website.

A verifiable credentia
It shows you completed a structured, practical program, and employers can confirm it.
Proof of hands-on work
The certificate comes with the projects behind it, which is what interviewers want to see.
A stronger resume
Recruiters scan resumes in seconds. A verified certificate and a project portfolio help you stand out.
| Note: The certificate is awarded on the completion of all modules and submission of your final projects. The certificate can also be verified on our official website. Get a professional credential with us for your career growth and strengthen your portfolio to improve hiring prospects.

How to Join the Data Analytics Course in Pune
To get started with Data Skill Hub’s Data Analytics Course in Pune, it is very simple. All you have to do is follow these three easy steps:
- Step 1: Click on Enrol Now
Use the button on this page or message us on WhatsApp.
- Step 2: Register Yourself
Share your name, phone number and email, and create your student account in about 2 minutes.
- Step 3: Pay Your Fee
Pay once or choose EMI. When payment is confirmed, you are officially a Data Skill Hub student, and details arrive by email.
Simple, Transparent Course Fees
Total course fee is ₹48,000 (GST inclusive). Choose the option that suits you — pay once and save, or split it into easy monthly EMIs at zero extra cost.
Comparing data analytics courses in Pune fees? Here's exactly what's included in ours — no hidden charges:
0% Cost EMI • No hidden charges
BEST VALUE • SAVE ₹8,000
💰 One-time Payment
₹40,000
₹48,000
You save ₹8,000 by paying upfront
- ✔ Full 6-month data program
- ✔ One-on-one guidance at your pace
- ✔ Lowest overall price
ZERO EXTRA CHARGES
📅 Easy Monthly EMI
₹8,000
/ month × 6
Total payable (incl. GST)
₹48,000
Pay once instead and it's only ₹40,000
- ✔ Learn now, pay as you go
- ✔ 0% interest, no hidden cost
- ✔ Light on your monthly budget
What the fee includes:
- The full 6-month program with all 8 courses
- Live Saturday and Sunday classes, offline or online
- 1 year of recorded session access and doubt support
- Real projects in every module
- Certificate on completion
- Placement support

Know more about the Course
Not ready to enrol yet? Book your free demo session at no cost. See exactly what you’ll learn and how you will learn.


Frequently Asked Questions
You will be able to clean messy data with Excel and Power Query, pull data with SQL, build interactive Power BI dashboards with DAX, analyse data with Python and Pandas, and present insights in PowerPoint. You will also automate repetitive reports with VBA and Python, and you will have projects to show for it.
You do not need extra certifications to start applying. The course covers the core stack that most analyst roles ask for: Excel, SQL, Power BI and Python. What matters most is your skill, your projects and how you do in interviews. If you later want a vendor certification, this course gives you a solid base.
Yes. Many of our students come from non-IT roles. You practise on business datasets like sales, finance, HR and customer satisfaction, so you can apply the skills to your own reports from the first weeks.
Yes. No coding or technical background is needed, and weekend classes fit around college. You will graduate with real projects and a certificate. Placement support helps with your resume and interviews, but jobs are not guaranteed.
The total fee is ₹48,000 including GST, or ₹40,000 if you pay in one go. It includes the 6-month program with all 8 courses, live classes, recorded access, doubt support, real projects, the certificate and placement support, with no hidden charges.
With 0% EMI you pay ₹8,000 a month for 6 months, for a total of ₹48,000. There is no interest or extra cost. Paying once costs ₹40,000. Connect with us on whatsapp to know more about the acceptable payment options.
We help with resume building, mock interviews, LinkedIn profile optimisation, and job alerts and referrals after you complete your projects. We do not promise a job, a fixed salary or a number of interviews, because those depend on your skills and the market.
Salary trackers in 2026 generally put fresher data analyst pay in Pune at roughly ₹3.5 to ₹6 lakh a year. It varies by company type, role and how you perform in interviews. Candidates with a strong project portfolio can earn more. Treat this as a market range, not a promise from us.
The certificate shows you completed a structured, hands-on program and submitted real projects. Employers look at your skills and portfolio most, and the certificate supports them. A recruiter can verify it on our website.
You can join online from anywhere. Classes are hybrid, so you can attend live online or offline at our Pune centre. Every class is recorded, and doubt support works on WhatsApp and email wherever you are.

Start Your Data Analytics Journey in Pune - Enrol Today
Join 2,500+ learners who have built their analytics careers with Data Skill Hub. Sit in on a free demo class, see how we teach, and decide with confidence. A new batch starts every alternate month.
India's Leading Public Speaking Institute
Free Counselling Session
Talk to our expert advisor and discover the right roadmap for your communication & personality growth.
- Personalized Career Guidance
- Confidence Building Roadmap
- Public Speaking Strategy Session
- Course Recommendation by Experts
Request a Call Back
Fill the form below and our team will contact you shortly.
Start Your Data Analytics Journey in Pune - Enrol Today
Every alternate month, we start a new batch.