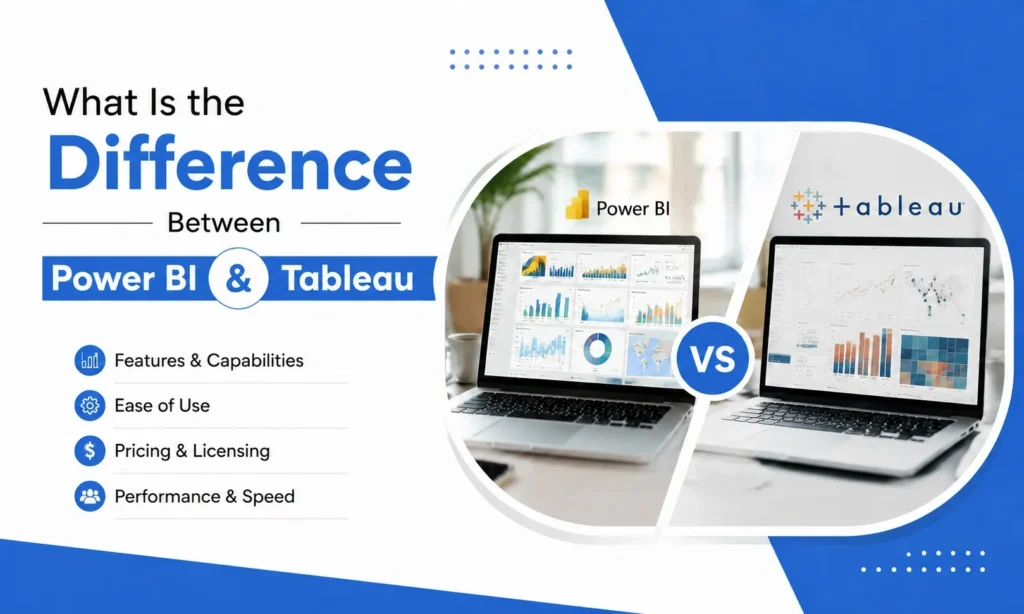
If you are exploring a career in data analytics, you have probably already heard two names being thrown around everywhere — Power BI and Tableau. Both tools help you make sense of data, companies across the world use both, and honestly, both are worth knowing. But when you are just starting out, you cannot learn everything at once — so the real question is:
What is the difference between Power BI and Tableau — and which one should you learn?
This question confuses thousands of students and professionals every year. In this blog, we break down the difference between Tableau and Power BI in a simple, clear, and professional way so you can make the right decision for your career.
What is Power BI?
Imagine you have thousands of rows of data and your manager wants a visual report by tomorrow — but you don’t know how to code. Power BI is Microsoft’s answer to exactly that problem. It lets you connect your data, clean it, and build interactive dashboards without writing a single line of code.
Power BI works smoothly with the tools most Indian companies already use every day — Excel, Azure, SQL Server, and Microsoft Teams — which makes it incredibly easy to fit into any existing workflow. This seamless compatibility makes it the ideal starting point for a data analytics journey.
What is Tableau?
Tableau is a popular data visualization tool built by Salesforce. It has strong features in terms of visual design, which enables users to build highly engaging and visually impressive dashboards to aid companies in making data-driven decisions.
Tableau has been around since 2003 and Salesforce bought it in 2019. Since then, big companies and data teams have been using it to handle large and complex data. It has great features and gives you a lot of flexibility — but if we are being honest, it takes much more time to learn compared to Power BI.
Tableau is the best choice for people who love deep analysis and excellent visualization.
Power BI vs Tableau – Key Differences
Factor | Power BI | Tableau |
Developer | Microsoft | Salesforce |
Pricing | Free to ₹750-₹1165/user/month (for creator) | Starts ~₹6,200/user/month (for creator) |
Ease of Use | Beginner-friendly | Moderate to steep |
Best For | SMBs & Microsoft ecosystem | Large enterprises |
Data Handling | Good for mid-size data | Excellent for large datasets |
Visualizations | Standard + Custom Visuals | Advanced & highly flexible |
AI Integration | Microsoft Copilot, Q&A | Tableau Pulse, Tableau Agent |
Job Demand (India) | Very High | High |
Detailed Comparison Between Power BI and Tableau (Section by Section)
1. Pricing & Licensing
When it comes to cost, Power BI clearly has the upper hand. Power BI offers a free desktop version that anyone can download and use immediately. Its Pro plan is available at approximately ₹750-₹1165/user/month as a creator— a very affordable option for individuals and small businesses.
Tableau starts at around ₹6,200/user/month as a creator— which is a significant amount, especially for students, freshers, and small businesses in India. For anyone on a tight budget, that price gap alone makes Power BI the clear and practical choice.
2. Ease of Use & Learning Curve
Power BI is considered easier to use than Tableau by most people. If you’re planning to join a Power BI course, its beginner-friendly interface and shorter learning curve make it an excellent place to start. Because its interface borrows heavily from Microsoft Excel, users find it highly intuitive and can adapt to the platform very quickly without a steep learning curve.
On the other hand, although Tableau gives one greater freedom to work, it is harder to use since creating complicated visualization takes knowledge of the software. For people who do not have experience working with data, Power BI would be a better choice.
3. Data Connectivity & Integration
Power BI makes it easy to work alongside the Microsoft applications you use every day. Your organization is using Excel, Azure, SQL Server, or Microsoft Teams? The Power BI tool will easily integrate with all of them.
Tableau supports a broader range of data connectors and works well with non-Microsoft environments. However, for the majority of Indian companies — which heavily rely on Microsoft tools — Power BI remains the more practical choice.
4. Data Visualization Capabilities
This is where Tableau truly stands out. Tableau’s visualization engine is more advanced and flexible, allowing data professionals to create complex, custom charts that go beyond standard templates.
Power BI offers a solid library of standard visuals along with a marketplace for custom visuals. For most business reporting needs, Power BI’s visualization capabilities are more than sufficient — and continue to improve with every update.
5. Performance & Speed
If your work involves huge datasets that run into millions of rows, Tableau is where it shines. Its Hyper in-memory data engine loads and processes complex data faster than most tools—making it a go-to choice for large enterprises.
Power BI is also exceptionally good at handling large datasets using its native VertiPaq compression engine. For normal business reports and standard corporate data volumes, Power BI’s performance is incredibly smooth and reliable.
6. Collaboration & Sharing
Most professionals in India already spend their day inside Microsoft Teams, Outlook, and SharePoint. Power BI connects directly with all of them — which means sharing a report or collaborating with your team does not require any extra steps or new tools. It just works.
Tableau makes use of Tableau Server and Tableau Cloud to enable collaborative work but, despite having many features, they require additional installation processes and expenses. In case of companies using Microsoft 365 services, using Power BI to collaborate would be a better choice.
7. AI & Advanced Analytics
Both tools are pretty advanced when it comes to AI technology. In Power BI, there is Microsoft Copilot, and it works kinda like a Q&A tool where you can type your questions, also there is this narrative analysis feature that goes ahead and generates insights on its own .
On the other hand, Tableau uses Tableau Pulse and Tableau Agent (powered by Salesforce’s Einstein AI) for smart predictions and automated data summaries. Both are great technologies, although the native execution of AI in Power BI via Copilot is often considered more seamlessly integrated into regular business workflows.
Which One Should You Learn for Career in India?
This is the question most Indian professionals and students are truly asking — and the answer is clear.
Power BI dominates the Indian job market. A quick search on any major job portal — Naukri, LinkedIn, or Indeed — will show significantly more job openings requiring Power BI skills compared to Tableau. Most Indian companies, especially in the IT, BFSI, manufacturing, and retail sectors, rely heavily on the Microsoft ecosystem, making Power BI the tool of choice.
From a salary perspective, both skills are valued. However, entry-level roles requiring Power BI are far more abundant, making it easier for freshers to land their first data job.
Key reasons to start with Power BI in India:
- Higher number of job openings across industries
- Lower learning curve — faster time to employment
- More affordable certification path (Microsoft PL-300)
- Strong demand in SMBs and large enterprises alike
- Microsoft ecosystem dominance in Indian corporate environment
That said, if you aspire to work in a global MNC or a data-heavy enterprise environment, learning Tableau in addition to Power BI can give you a competitive edge.
Ready to Learn Power BI?
Join DataSkillHub’s Power BI Course and gain practical experience with real-world projects to become industry-ready.
Conclusion
The difference between Power BI and Tableau comes down to your goals, budget, and work environment. Tableau offers superior visualization capabilities and is ideal for large enterprises with complex data needs. Power BI, however, is more affordable, beginner-friendly, and deeply integrated with Microsoft tools — making it the smarter choice for most professionals in India.
If you want to start your data analytics journey today, there is no better way than learning Power BI. It will open a wide range of doors for you, especially in the Indian job market. Learn how to use this software, become certified, and propel yourself forward.
Do you face difficulties in analyzing your data? Transforming raw data into valuable insights just got easier with our solutions.
Frequently Asked Questions
Power BI is a Microsoft tool known for its affordability and ease of use, while Tableau is a Salesforce product known for advanced visualizations. The key differences lie in pricing, learning curve, integration capabilities, and target audience.
Power BI is generally easier to learn, especially for those familiar with Microsoft Excel. Tableau has a steeper learning curve but offers more advanced visual flexibility.
Power BI has considerably more job openings in India throughout numerous domains which include IT, BFSI, and retail as compared to Tableau. It is an appropriate desire for novices and profession changers trying to begin their data journey.
Yes, of course. Many data professionals start their journey with Power BI and pick up Tableau once they are more confident. This is because Power BI helps you get faster into the job market, while Tableau is something you can learn later on. If you want to take a Power BI course in Pune, then you can contact our team at Data Skill Hub to get started on your journey with us.
Power BI gives a free desktop model and a Pro plan beginning at approximately ₹750-₹1,165/user/month. Tableau starts at around ₹6,200/user/month, making Power BI a considerably extra low cost option — especially for people and small corporations in India.