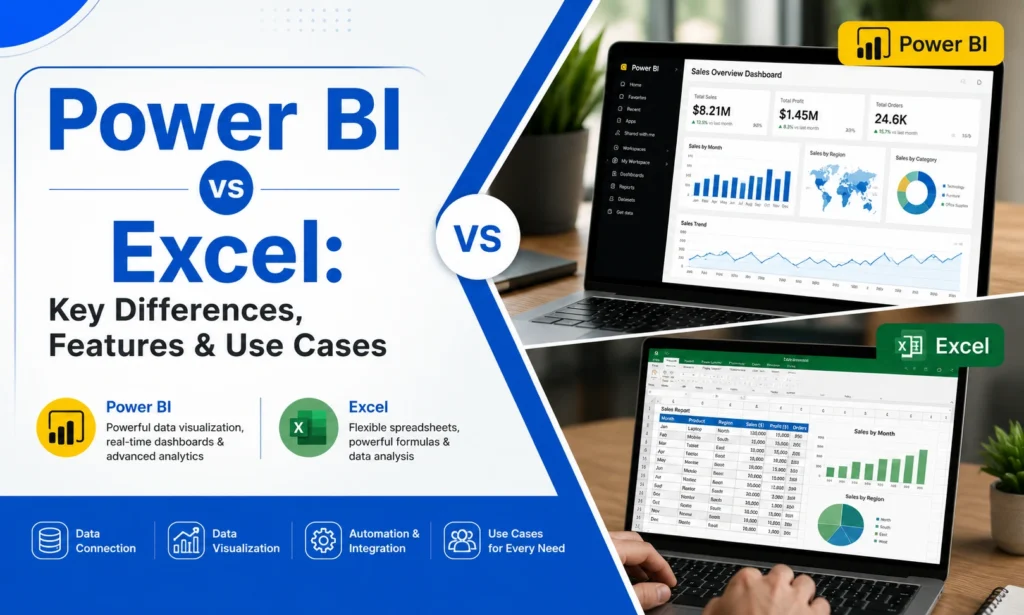
If you have been working with data for even a little while, you have probably asked yourself this question — should I use Excel or Power BI? You are not alone. This is one of the most common problem professionals, students, and job seekers face in 2026.
Both tools come from Microsoft. Both deal with data. But they are built for very different purposes — and choosing the wrong one can slow you down significantly.
In 2026, both tools are more powerful than ever. So the real question is not which one is better — it is which one is right for you.
In this blog, you will get a clear, no-fluff breakdown of Power BI vs Excel — their key differences, a side-by-side features comparison, and practical use cases. By the end, you will know exactly which tool fits your work, your role, and your career goals.
What is Microsoft Excel?
People who start their workday with Excel spreadsheets face the highest chance of encountering this application. Microsoft Excel has served as the primary data management software since its launch in the 1980s. Today, an Excel course is one of the most popular starting points for anyone looking to build strong data analysis and spreadsheet skills.
Excel provides users with the ability to handle data storage and organization through its row and column structure which pairs with formula operations for data analysis. Users who need to build financial models or handle their budget finances can use Excel to create personalized solutions. The tool serves various professional users including accountants and analysts and HR staff and students and business owners who operate in all business sectors.
What is Power BI?
Microsoft Power BI is a business intelligence tool which Microsoft launched in 2013. The system operates as a dedicated platform which enables users to create data visualizations and generate business analytics reports.
Power BI functions as the right solution for users who need to create interactive dashboards and visual reports from their extensive datasets. The platform establishes connections with multiple data sources while it performs automated data refresh operations and enables users to distribute their reports through simple organizational sharing functions. The Power BI platform serves as a common tool which data analysts and business intelligence professionals and managers use to obtain instant business information.
Power BI vs Excel: Key Differences You Must Know Before Choosing the Right Tool
Learning Curve
If you are just starting your data journey, Excel is much easier to pick up. You already know the basic layout — rows, columns, and cells. The formulas feel natural, and you can start doing useful work within days of learning.
Power BI has a steeper learning curve. You need to understand how to connect data sources, build data models, and write DAX (Data Analysis Expressions) formulas. But here is the good news — if you already know Excel, learning Power BI becomes significantly faster because many concepts carry over. A structured Power BI course can make the transition even easier with guided, hands-on learning.
Flexibility
Excel is incredibly flexible. You can use it for almost anything — budgets, trackers, invoices, data analysis, project planning, and even simple databases. It gives you complete control over every cell, formula, and format.
Power BI is more structured. It is designed specifically for reporting and visualization, so it does not give you the same free-form flexibility as Excel. But within its area — building dashboards and visual reports — it is far more powerful than Excel can ever be.
Data Size & Model Complexity
These two tools operate at completely different levels which make them totally separate from each other. Excel slows down when users need to manage more than several hundred thousand rows of data. The process of working with an enormous Excel spreadsheet which takes forever to open and calculate becomes all too familiar to those who have experienced it.
Power BI manages data sets with millions of rows which it processes without showing any signs of performance degradation. The in-memory data engine VertiPaq processes large data sets through compression techniques to achieve fast operational efficiency. Power BI stands out as the best choice when you need to handle big data and complicated data models which combine information from various sources.
Cloud-based Features & Accessibility
Excel has cloud capabilities through Microsoft 365, which lets you save files on OneDrive and collaborate in real time. But traditional Excel still relies heavily on your local machine and file sharing via email or shared drives.
Power BI is cloud-first. Power BI Service (the online version) lets you publish reports, set up automatic data refresh, and share dashboards with your entire team — all from a browser. If your team works remotely or across different locations, Power BI gives you far better accessibility and collaboration.
Visualization Options
Excel gives you charts — bar charts, pie charts, line graphs, and a few more. They are functional and get the job done for basic reporting. But they are static, and customizing them takes time and effort.
Power BI was built for visualization. You get a rich library of visuals — maps, treemaps, waterfall charts, KPI cards, slicers, and even custom visuals from the Power BI marketplace. Everything is interactive and visually polished. If your goal is to impress stakeholders with a professional dashboard, Power BI is in a different league.
Chart Interactivity
When you look at an Excel chart, you see what you see. You cannot click on a bar and have the rest of the report change dynamically. Everything is static unless you manually add filters or slicers — which takes extra setup.
In Power BI, every visual is interactive by default. When you click on a data point in one chart, every other visual on the page automatically filters to reflect that selection. This cross-filtering feature makes exploring data fast, intuitive, and incredibly powerful for business presentations and decision making.
Cost
Excel is part of Microsoft 365, which most organizations already pay for. So for most people, Excel comes at no extra cost — it is already on your laptop.
Power BI Desktop is completely free to download and use. However, if you want to share reports with others using Power BI Service, you need Power BI Pro ($14/user/month) or Power BI Premium for larger organizations. So for individual use, Power BI is free — but for team sharing and collaboration, there is a cost involved.
Data Security
The security level of Excel files directly depends on the way users handle their stored documents. Users can protect their workbooks with passwords but they lose control over what others will do with the file after they receive it. Users lose their ability to monitor different file versions through email-based file sharing practices.
Power BI provides security features which operate at the enterprise level. Power BI Service includes row-level security (RLS) which enables users to define specific data visibility rules for each individual user who accesses the same report. The system connects with Microsoft Azure Active Directory to verify user identities which establishes a secure environment for business teams to exchange their protected information.
Also Read: What is the Difference Between Power BI and Tableau
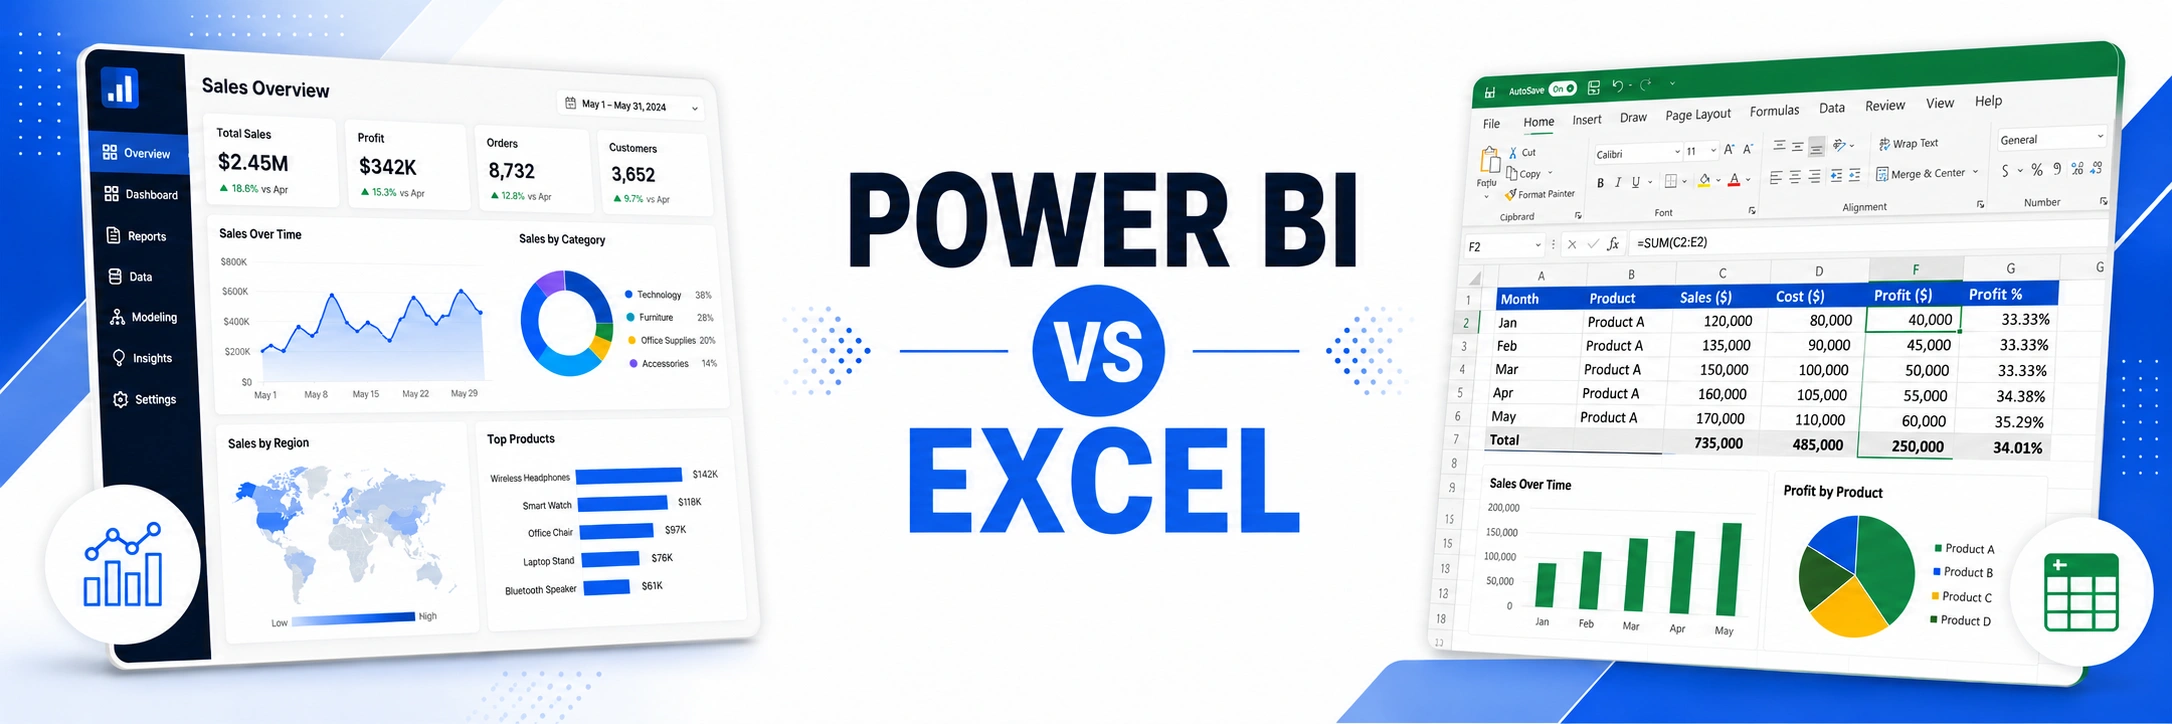
Excel vs Power BI Features Breakdown: Everything You Need to Know
| Feature | Microsoft Excel | Power BI |
|---|---|---|
| Primary Use | Spreadsheets, calculations, analysis | Data visualization, BI reporting |
| Data Capacity | Up to ~1 million rows | Millions of rows |
| Visualization | Basic static charts | Rich interactive dashboards |
| Chart Interactivity | Limited (manual slicers) | Full cross-filtering by default |
| Learning Curve | Easy for beginners | Moderate (steeper but manageable) |
| Cloud Collaboration | Microsoft 365 / OneDrive | Power BI Service (cloud-first) |
| Data Sources | Excel files, CSV, some connectors | 100+ data source connectors |
| Automatic Data Refresh | Manual | Scheduled automatic refresh |
| Cost | Included in Microsoft 365 | Free desktop / Paid for sharing |
| Security | File-level password protection | Row-level security, Azure AD |
| Custom Visuals | Limited | Large marketplace available |
| DAX / Formulas | Excel formulas & functions | DAX (powerful but different) |
| Best For | Individual analysis, calculations | Team reporting, dashboards |
Power BI vs Excel: Use Cases That Help You Choose the Right Tool
When to Use Excel
Excel is your best friend when you are working with smaller datasets, financial models, or day-to-day calculations. If you are building a budget tracker, managing an inventory list, creating an invoice template, or running a quick analysis on a few thousand rows of data — Excel is the fastest and most practical choice. It is also the right tool when you need complete flexibility over your data layout and formulas.
If you are someone who works in finance, accounting, HR, or operations, Excel will likely remain your primary tool for a long time.
When to Use Power BI
Power BI becomes the best option when you need to create visual data stories from big data sets which decision makers can use. Power BI serves as the perfect solution for users who want to link data from their CRM system with their database and sales system into one automated dashboard or presenting an HR attrition report to leadership — Power BI turns raw data into a visual story that anyone can understand.
If you are a data analyst or manager who builds weekly reports for leadership, Power BI saves you hours — and makes those reports look far more professional.
When to Use Both Together
Here is something many people do not realize — Excel and Power BI work beautifully together. You do not always have to choose one over the other. Many professionals use Excel for data entry, cleaning, and calculations — and then connect that Excel file directly to Power BI to build dashboards on top of it.
Master Power BI & Excel with Industry-Ready Training
Build practical skills in Power BI, Excel, SQL, and data analytics through hands-on projects and expert-led training. Join Data Skill Hub and gain the confidence to analyze data, create interactive dashboards, and prepare for high-demand analytics careers.
Conclusion
Now, you have a clear picture of how Power BI and Excel differ — and more importantly, when to use each one.
If you are just starting out, Excel is where you should begin. It builds your data foundation and teaches you how to think analytically. Once you are comfortable with Excel, stepping into Power BI becomes a natural and exciting next move — one that can significantly boost your career in data analytics and business intelligence.
The truth is, in 2026, the most in-demand professionals are not those who know just one tool — they are the ones who know how to use both together strategically.
Frequently Asked Questions
No, they are complementary tools. Excel continues to lead the market for manual data entry work and accounting tasks and random mathematical operations. Power BI exists as a separate business intelligence system which developers created to handle big data operations and create automated reports and distribute interactive dashboard content.
Power BI delivers scale and advanced interactive security. The system handles massive data volumes which reach hundreds of millions of rows while maintaining its operational speed. The system automatically generates cross-filtering visualizations and enforces Row-Level Security to control which data users can access depending on their company position.
The learning curve is moderate but highly manageable. If you already use Power Query, the interface will feel familiar. The primary hurdle is mastering DAX formulas, which calculate data across entire table columns rather than individual spreadsheet cells.
Excel wins for modeling, while Power BI wins for executive tracking. Excel is unrivaled for building complex financial statements and manual projections. However, Power BI is superior for automated, high-level visual tracking of live corporate revenue and regional store expenses.
They connect seamlessly through the Microsoft Fabric ecosystem. Users can build massive, secure data models in Power BI and use the "Analyze in Excel" feature to safely query that exact data inside a familiar, local desktop Pivot Table.