
Data Skill Hub

Best Data Analyst Course for Beginners: Skills, Tools & Roadmap 2026

Best Data Analyst Course for Beginners: Skills, Tools & Career Opportunities

Data is the core of decision-making in nearly all industries now. Businesses utilize data to analyze their customers better, improve operations, assess the effectiveness of marketing campaigns, forecast future demands, and find new business opportunities. This is why data analytics has turned into one of the most promising career paths for recent graduates, professionals, and even people wishing to change their career entirely.

However, if you are still in the very beginning of your journey, there are certain questions that bother every beginner – which is the best data analyst course for beginners? Which skills should you obtain to be truly job ready?

In this article, we will cover all you need to know about becoming a data analyst including the proper skills, tools, projects, etc. let’s dive in.

Quick Answer: What Is the Best Data Analyst Course for Beginners?

The best data analyst course for beginners is one that combines:

  • Excel or Google Sheets
  • SQL
  • Data cleaning and preparation
  • Basic statistics
  • Power BI or Tableau
  • Python fundamentals
  • Data visualization
  • Business and analytical thinking
  • Data storytelling and communication
  • Real-world projects
  • Portfolio development
  • Interview and career preparation

You do not need to learn every analytics technology at once. A practical progression is to build a foundation with Excel → SQL → Power BI/Tableau → statistics → Python, then add specialized technologies according to your career goals. Current 2026 learning guides similarly emphasize these core skills while recommending that beginners avoid trying to master every tool simultaneously.

What Does a Data Analyst Do?

A data analyst transforms raw information into useful insights that help organizations make better decisions. A typical workflow might look like this: 

Business Question → Data Collection → Data Cleaning → Data Analysis → Visualization → Insights → Recommendation

For example, imagine an e-commerce company notices that its sales have fallen. A data analyst might:

  1. Extract sales information using SQL.
  2. Clean and organize the data using Excel or Python.
  3. Analyze sales by product, region, and customer segment.
  4. Identify trends and unusual changes.
  5. Build a Power BI or Tableau dashboard.
  6. Explain the findings to business stakeholders.
  7. Recommend actions based on the evidence.

This is why data analytics is about much more than creating charts. A successful analyst must connect data with business decisions.

Skills You Should Learn in a Beginner Data Analyst Course

1. Excel and Spreadsheets

Excel remains one of the most useful starting points for beginners. You should learn:

  • Formulas and functions
  • XLOOKUP/VLOOKUP
  • IF statements
  • SUMIFS and COUNTIFS
  • Sorting and filtering
  • Pivot tables
  • Charts
  • Conditional formatting
  • Data cleaning
  • Power Query
  • Basic dashboard creation

Excel is particularly valuable because it allows beginners to understand how datasets work before moving into databases and programming.

Why learn Excel first?

It gives you a relatively simple environment for learning fundamental analytical thinking: identifying patterns, calculating metrics, comparing groups, and presenting results. If you want structured, hands-on guidance instead of random YouTube tutorials, check out this Advanced Excel with AI course, which covers everything from formulas to dashboards with live mentorship. 

2. SQL
SQL

SQL is one of the most important technical skills for aspiring data analysts. SQL allows analysts to retrieve and manipulate information stored in relational databases.

A beginner course should cover:

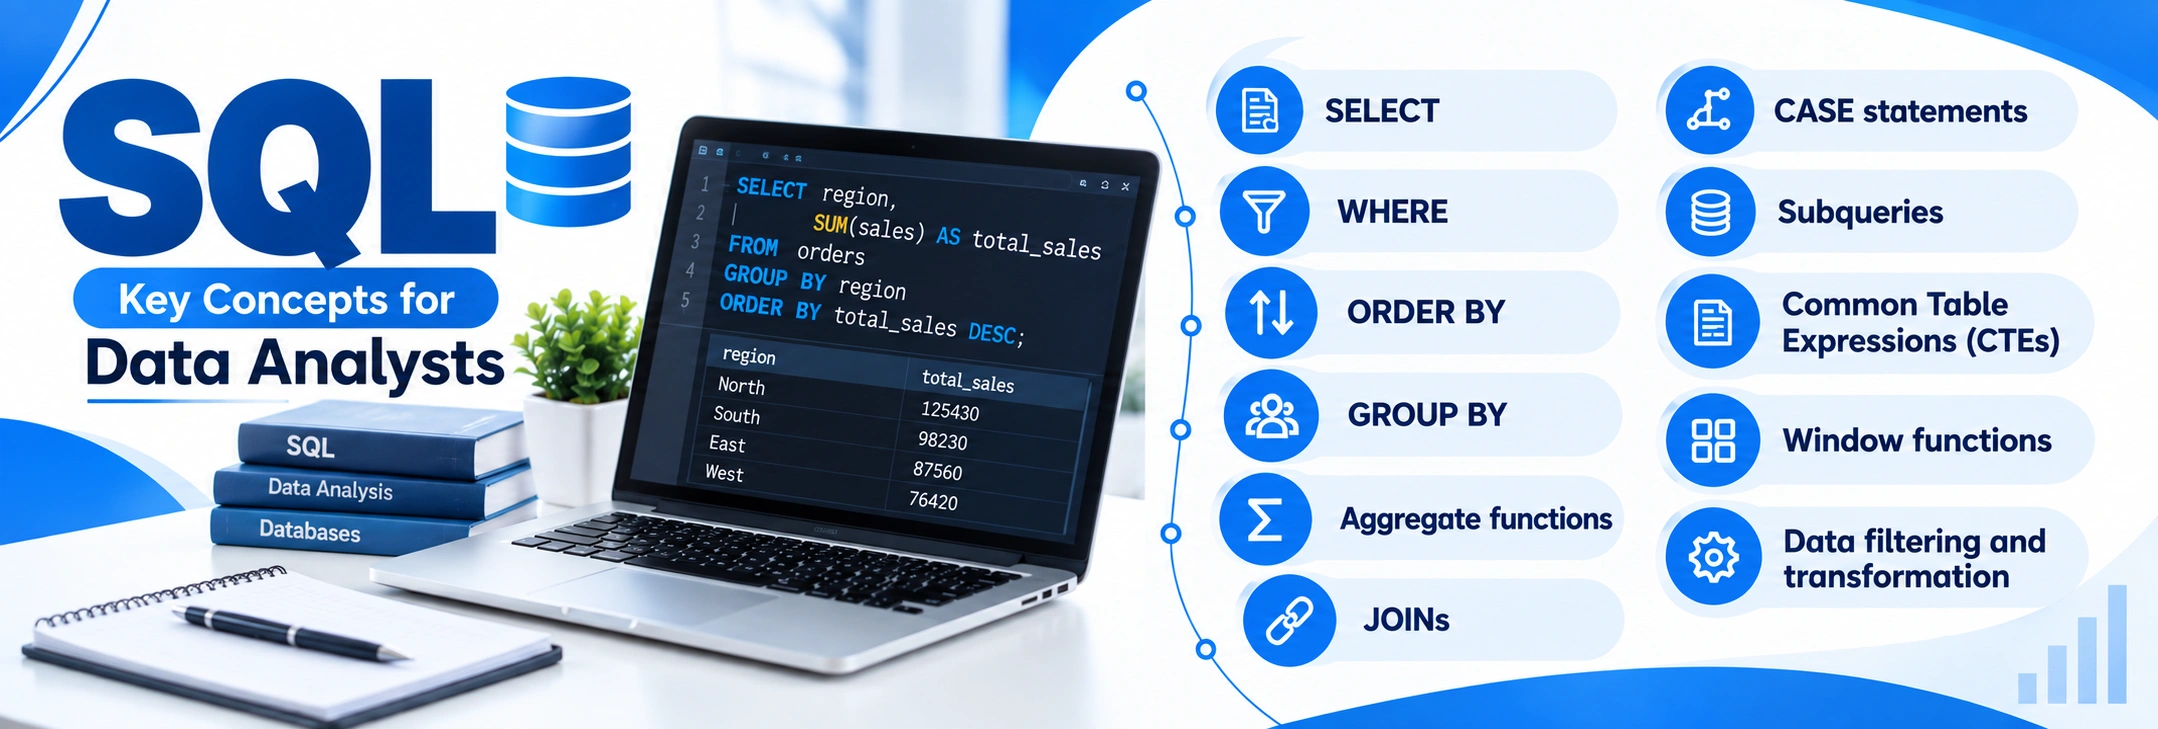
  • SELECT
  • WHERE
  • ORDER BY
  • GROUP BY
  • Aggregate functions
  • JOINs
  • CASE statements
  • Subqueries
  • Common Table Expressions (CTEs)
  • Window functions
  • Data filtering and transformation
SQL Query
SELECT
    region,
    SUM(sales) AS total_sales
FROM orders
GROUP BY region
ORDER BY total_sales DESC;

This simple query can answer a real business question: Which regions generated the most sales?

Industry-oriented 2026 guidance continues to place SQL among the core skills for entry-level analysts because analysts frequently need to extract and transform data from databases.

3. Statistics

You don’t necessarily need advanced mathematics to begin a data analyst career. However, you should understand fundamental statistics, including:

  • Mean, median, and mode
  • Percentages and ratios
  • Range and variance
  • Standard deviation
  • Distributions
  • Correlation
  • Outliers
  • Sampling
  • Confidence intervals
  • Hypothesis testing
  • Basic A/B testing

Statistics helps you avoid drawing incorrect conclusions from data. For example, if sales increased by 10%, you need to ask:

Is this increase meaningful, or could it simply be normal variation?

That type of thinking is what separates data analysis from simply calculating numbers.

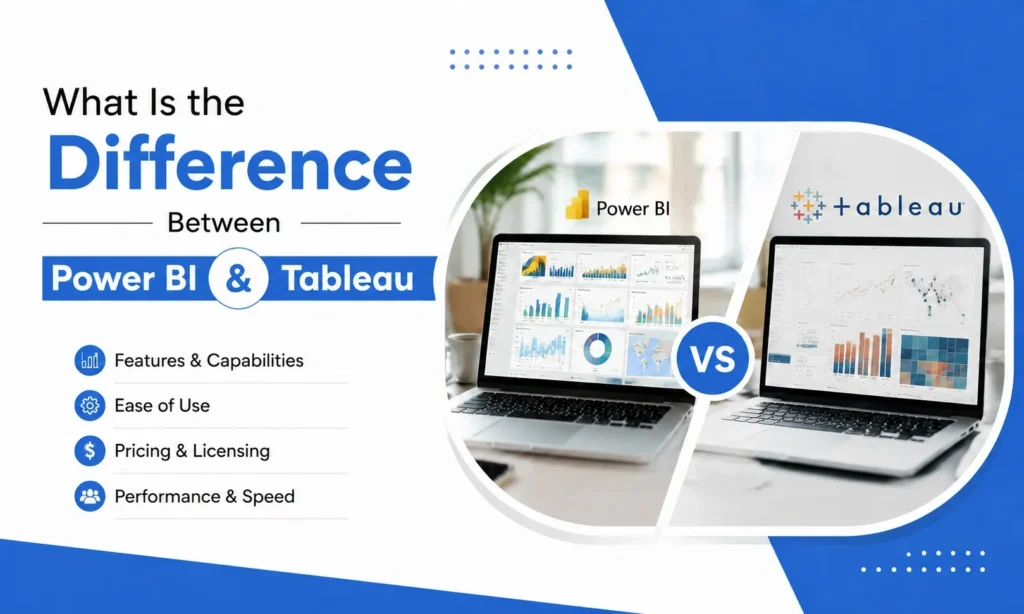
4. Power BI or Tableau

A good data analyst needs to communicate findings visually. Two major business intelligence and visualization platforms are Power BI and Tableau. You should learn at least one deeply before trying to master both. If Power BI feels overwhelming to learn alone, this Power BI Advanced course walks you through data modeling, DAX, and interactive dashboards step by step. 

Power BI

Learn:

  • Data importing
  • Power Query
  • Data transformation
  • Data modeling
  • Relationships
  • DAX basics
  • Interactive dashboards
  • Filters and slicers
  • KPI cards
  • Dashboard design

Tableau

Learn:

  • Connecting datasets
  • Dimensions and measures
  • Calculated fields
  • Charts
  • Filters
  • Dashboards
  • Interactive visualizations
  • Storytelling

Google’s beginner analytics program, for example, includes Tableau alongside spreadsheets, SQL, R, and practical case-study work.

For beginners targeting Indian enterprise roles, Power BI is often a practical first choice, while Tableau is also valuable for organizations that use it extensively.

5. Python for Data Analytics
Python for Data Analytics

Python isn’t necessarily the first tool you need to learn, but it can significantly expand your capabilities. Focus on analytics rather than trying to become a software developer.

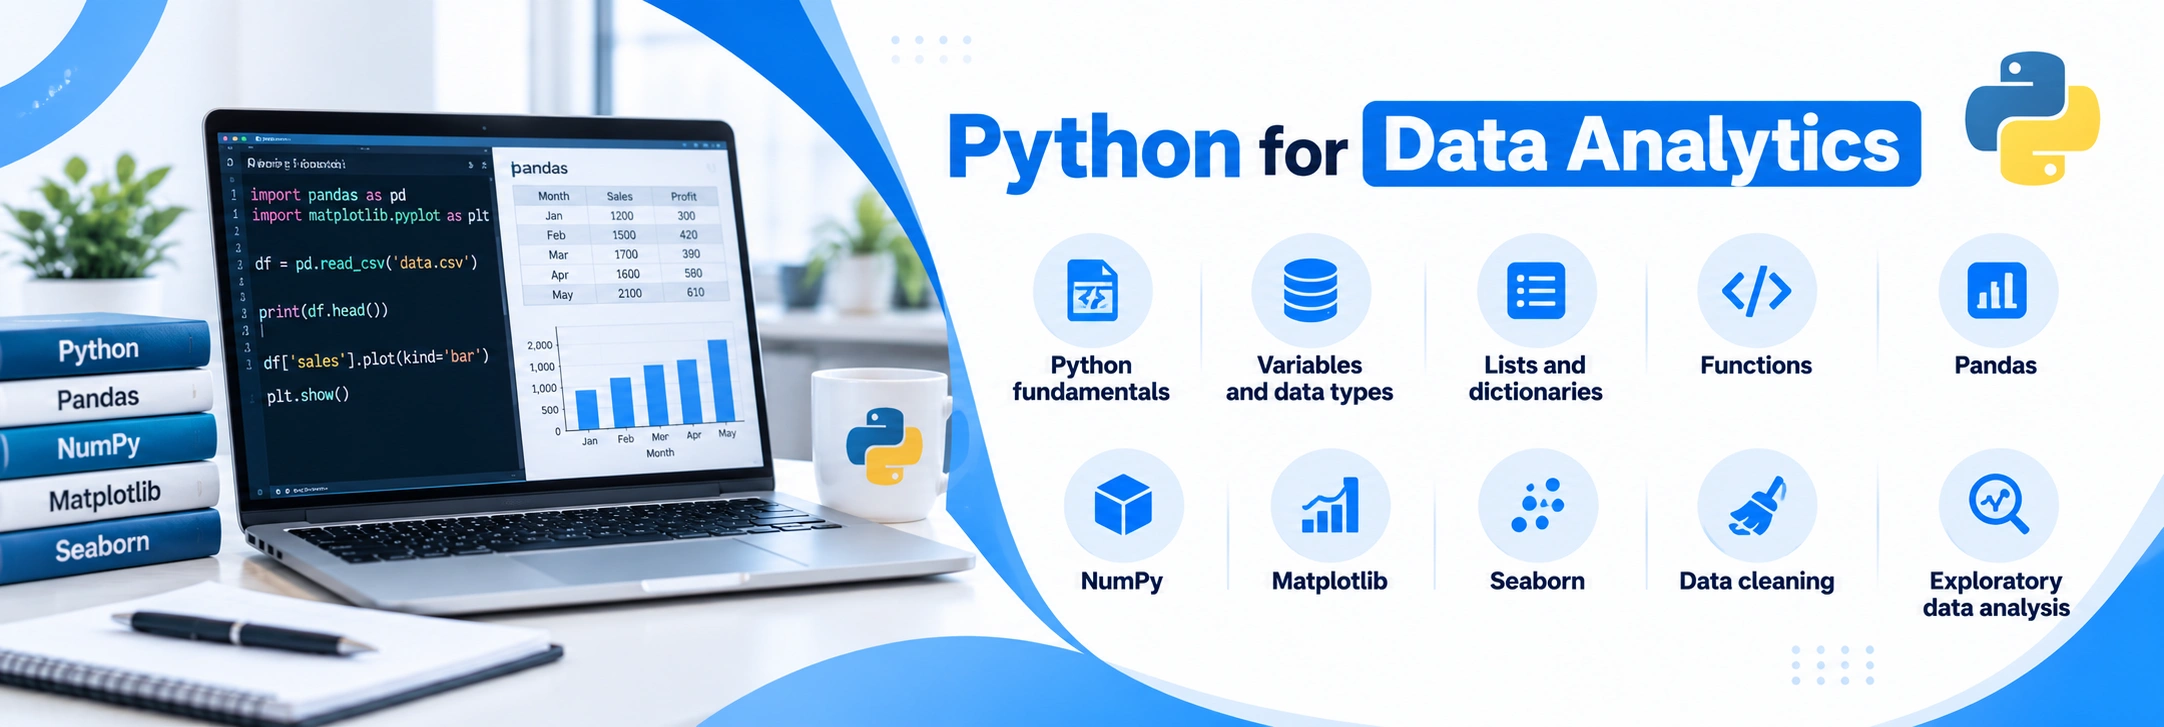
Important topics include:

  • Python fundamentals
  • Variables and data types
  • Lists and dictionaries
  • Functions
  • Pandas
  • NumPy
  • Matplotlib
  • Seaborn
  • Data cleaning
  • Exploratory data analysis

For example, Pandas can help you clean and analyze datasets that would be difficult to manage manually in a spreadsheet. A sensible beginner progression is:

Excel → SQL → Power BI/Tableau → Statistics → Python

This allows you to build practical analytical skills before tackling programming.

6. Data Cleaning

Real-world data is rarely perfect. You may encounter:

  • Missing values
  • Duplicate records
  • Incorrect formats
  • Spelling inconsistencies
  • Outliers
  • Invalid dates
  • Incorrect categories
  • Inconsistent units

Therefore, data cleaning should be a major part of any data analyst course for beginners. A course should teach you how to identify problems, determine whether they affect your analysis, and document the transformations you make.

7. Data Visualization and Storytelling

Knowing how to create a chart is not enough. You also need to know:

What should the audience understand from this chart?

A good analyst can turn a complicated dataset into a simple story.

For example:

“Revenue declined 12% in Q3, primarily because repeat purchases fell among customers acquired through Channel X.”

That is much more useful than saying:

“Here is a chart showing revenue.”

Learn to choose appropriate visualizations, highlight important findings, avoid misleading charts, and explain recommendations clearly.

8. Business and Communication Skills

One of the most overlooked data analyst skills is communication. Analysts often work with:

  • Marketing teams
  • Finance teams
  • Sales teams
  • Product managers
  • Operations teams
  • Senior management

You need to understand what stakeholders actually want to know. Strong analysts ask questions such as:

  • What business problem are we solving?
  • Which metric matters?
  • Who will use this analysis?
  • What action could result from the finding?
  • What assumptions are we making? do you have a blog to assign?
  • This combination of technical ability and business thinking is a major part of becoming job-ready.
Tools to Learn in a Data Analyst Course

Tool What You Use It For
Excel Analysis, cleaning, reporting
SQL Querying databases
Power BI Dashboards and BI
Tableau Visualization and dashboards
Python Advanced analysis and automation
Pandas Data manipulation
NumPy Numerical computing
Git/GitHub Portfolio and version control
R Statistical analysis
BigQuery/Snowflake Cloud data platforms

The goal isn’t to collect software skills like badges. Learn tools according to the problems they solve.

Best Data Analyst Learning Roadmap for Beginners

You don’t need to learn everything simultaneously. You don’t need to learn everything simultaneously. Rather than piecing together random tutorials, a structured path saves time. This Data Analytics with AI program follows this exact roadmap — Excel, SQL, Power BI, and Python — under one live, mentor-led course. 

Month 1: Excel + Analytics Fundamentals

Learn:

  • Excel formulas
  • Pivot tables
  • Data cleaning
  • Charts
  • Basic statistics
  • Analytical thinking

Project: Sales performance dashboard.

Months 2–3: SQL

Learn:

  • SELECT
  • Filtering
  • Aggregation
  • JOINs
  • CASE
  • CTEs
  • Window functions

Project: Analyze customer and sales transactions.

Month 4: Power BI or Tableau

Learn:

  • Data modeling
  • Dashboard design
  • Calculated metrics
  • Filters
  • Interactive reports

Project: Create an executive business dashboard.

Month 5: Python

Learn:

  • Python basics
  • Pandas
  • NumPy
  • Data cleaning
  • Exploratory analysis
  • Visualization

Project: Analyze a large public dataset.

Month 6: Portfolio + Interview Preparation

Build 3–5 high-quality projects rather than dozens of small exercises.

For each project, explain:

Problem → Data → Cleaning → Analysis → Visualization → Insight → Recommendation

That structure demonstrates the complete analytical process.

Data Analyst Projects for Beginners

Here are some portfolio project ideas.

1. E-Commerce Sales Analysis

Analyze:

  • Revenue
  • Orders
  • Profit
  • Product categories
  • Customer segments
  • Regional performance

Tools: Excel + SQL + Power BI

2. Customer Churn Analysis

Investigate:

  • Customer retention
  • Churn rate
  • Subscription type
  • Customer demographics
  • Engagement patterns

Tools: SQL + Python + Power BI

3. Marketing Campaign Analysis

Measure:

  • Conversion rate
  • Customer acquisition
  • Campaign performance
  • ROI
  • Customer segments

Tools: Excel + SQL + Tableau/Power BI

4. HR Analytics Dashboard

Analyze:

  • Employee turnover
  • Department performance
  • Absence
  • Tenure
  • Recruitment trends

Tools: Excel + Power BI

5. Financial Performance Dashboard

Track:

  • Revenue
  • Expenses
  • Profit margins
  • Monthly trends
  • Budget vs. actual performance

Tools: SQL + Power BI

Career Opportunities After a Data Analyst Course

A beginner data analytics course can prepare you for several entry-level roles. Common career options include:

  • Data Analyst
  • Junior Data Analyst
  • Associate Data Analyst
  • Business Analyst
  • Operations Analyst
  • Marketing Analyst
  • Financial Analyst
  • Reporting Analyst
  • Business Intelligence Analyst
  • Product Analyst
  • Data Science Analyst

Google’s foundational certificate specifically lists roles such as Data Analyst, Associate Data Analyst, Operations Analyst, Business Systems Analyst, and Data Science Analyst among potential pathways. With experience, you can move toward roles such as:

Senior Data Analyst → Analytics Lead → BI Analyst/Manager → Analytics Manager

You can also specialize in areas such as product analytics, marketing analytics, finance, operations, or eventually data science. If you want a deeper breakdown of how to actually start applying and building your career path, check out our detailed guide: How to Start a Career in Data Analytics from Scratch

Is Data Analytics a Good Career in 2026?

Yes, but candidates should approach the field realistically. The strongest opportunities are not simply for people who have completed a certificate. Employers want people who can solve problems with data and explain their findings.

The broader analytical job market also shows continued demand. For example, the U.S. Bureau of Labor Statistics projects 12% employment growth for operations research analysts from 2025 to 2035, substantially faster than the projected 3% growth across all occupations.

For Indian job seekers, the fundamentals are particularly important: SQL, Excel, a BI platform, statistics, and increasingly Python are repeatedly emphasized in current India-focused career guidance.

How to Choose the Best Data Analyst Course

Choosing the right course feels overwhelming when every platform claims to be the best. Here is what actually matters when making your decision.

  • Check if the curriculum covers the full workflow – A good course should take you from data collection to final recommendation – not just teach isolated tools without any real context.
  • Look for hands-on projects with real datasets – Theory alone will not get you hired. Make sure the course includes messy, real-world datasets that actually challenge your thinking and problem-solving ability.
  • Confirm SQL and statistics are covered properly – Many courses briefly mention SQL and move on. You need substantial practice – not just one introductory module that disappears after two lessons.
  • Check if career support is included – Resume guidance, interview preparation, portfolio reviews, and job-search strategies matter as much as the technical content itself. Do not overlook this completely.
  • Read honest reviews from actual learners – Do not rely on the course landing page. Search for real reviews on Reddit, LinkedIn, and YouTube from people who actually completed it and got hired.
  • Make sure it fits your current level – Some courses marketed as beginner-friendly still assume prior knowledge. Go through the free preview lessons carefully before paying for anything.

Ultimately the best course is the one you actually finish. Completion with real projects matters far more than the brand name on your certificate.

Common Mistakes Beginners Should Avoid

Most beginners do not fail because of lack of talent. They fail because of avoidable mistakes that slow down their progress right from the beginning.

  • Trying to learn every tool at once – Jumping between Excel, SQL, Python, Tableau and R simultaneously leads to confusion and burnout. Master one tool properly before moving to the next.
  • Watching tutorials without practicing – Watching hours of video content feels productive but it is not. Real learning only happens when you open the tool and work with actual data yourself.
  • Skipping statistics completely – Many beginners rush straight into tools and ignore statistics. Without basic statistical thinking you will draw wrong conclusions from data without even realising it.
  • Building too many small projects – Ten half-finished mini projects impress nobody. Three well-documented end-to-end projects that show your complete thinking process are far more valuable to employers.
  • Waiting until they feel fully ready – Many beginners spend months learning and never apply for jobs because they feel they need to learn one more thing. Start applying earlier than you think you should.
  • Ignoring communication and storytelling skills – Technical skills get you noticed but communication skills get you hired. If you cannot explain your findings clearly to non-technical people your analysis has very little real value.

Start smart, stay consistent, and avoid these mistakes early. The analysts who grow fastest are not the most talented – they are simply the most focused.

Final Verdict

If you’re starting from zero, don’t choose a course simply because it advertises the largest number of tools. Choose a program that gives you a structured path from fundamentals to real-world projects.

The ideal learning sequence is:

Excel → SQL → Statistics → Power BI/Tableau → Python → Projects → Portfolio → Interviews

The most important outcome isn’t the certificate- it’s your ability to take a messy dataset, ask the right question, analyze the information, build a clear visualization, and communicate a useful recommendation. A beginner-focused certificate such as Google’s Data Analytics Certificate is one example of a structured starting point: its current curriculum includes spreadsheets, SQL, Tableau, R, visualization, and a capstone case study, and it is designed for learners without prior experience.

Ultimately, the best data analyst course for beginners is the one that helps you move from “I know the tools” to “I can use data to solve a business problem.” That is the skill employers ultimately care about. 

Ready to start your data analytics career? Join Data Skill Hub’s live weekend classes in Pune — taught personally by a Microsoft Certified Trainer.

Frequently Asked Questions

Yes. You can begin with Excel and SQL before learning Python. A number of beginner-focused analytics programs are designed for people without prior experience.

A focused learner can build foundational skills within several months. Your timeline depends on your previous experience, study hours, practice quality, and the depth of skills you want to achieve.

For most beginners, SQL first is a practical choice because it is fundamental to working with databases. After building SQL and visualization skills, add Python for more advanced analysis and automation.

Neither is universally better. Both are powerful visualization platforms. Choose based on the jobs and industries you're targeting, then become highly proficient in one before expanding to the other.

Yes. Data analysis can provide a strong foundation for data science. You can progressively add Python, advanced statistics, machine learning, experimentation, and other data-science skills.

Leave a Comment

Your email address will not be published. Required fields are marked *

Scroll to Top