The world of data analytics has exploded recently. It seems like no business – small or large – operates without leveraging data for their operations and decision-making. Understanding customer needs and assessing performance become possible with the help of the data-driven approach. And that is precisely the reason data analysts are in such high demand nowadays.
But there is one thing people rarely talk about when starting on their journey to become a data analyst – being a data analyst does not mean knowing how to use some tools. It involves having deep knowledge of the processes related to data cleansing, analysis, reporting, and interpretation.
But how should one begin? The most straightforward answer is to choose a structured data analyst course that covers Excel, SQL, Power BI, basics of statistics, and Python in the correct sequence, along with hands-on projects and interview preparation. In the correct sequence. With hands-on projects and interview preparation.
That is exactly what this guide will cover for you step-by-step, from learning the right tools to building practical projects and preparing to start a career in data analytics. You will also get to know how Data Skill Hub can make this process easier for you. Let’s get started!
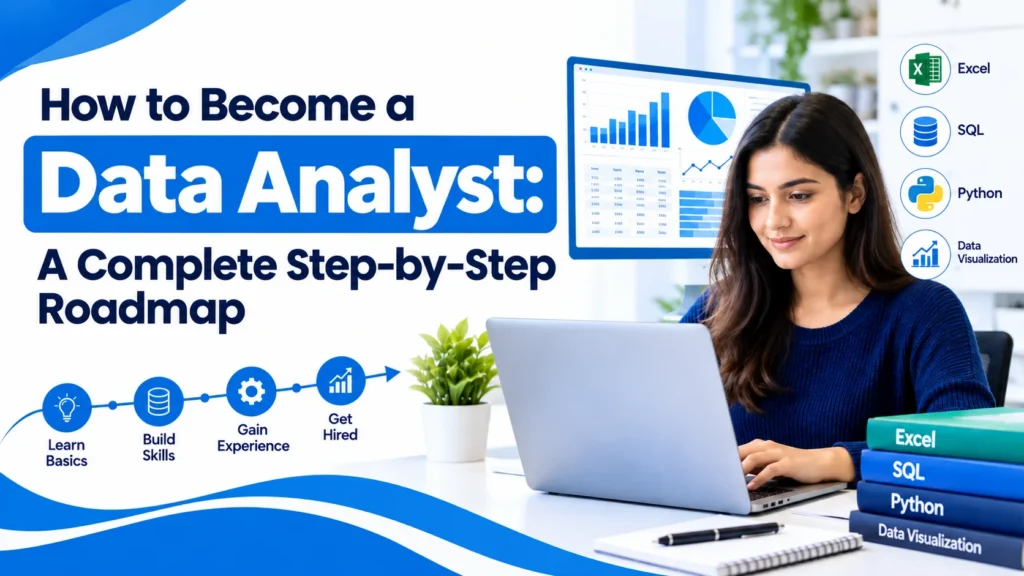
How to Become a Data Analyst: A Step-by-Step Learning Path
Step 1: Understand What a Data Analyst Actually Does
Before touching any tool or software – first understand what this job is really about. A data analyst collects data, cleans it, studies it, and turns it into useful information that helps companies make better decisions. They build reports, spot trends, and explain findings to managers in simple language.
For example – a sales analyst checks monthly data to see which products are selling and which regions are struggling. That analysis directly helps the business improve. So do not just jump into learning tools. First understand how data supports real business decisions. Everything else becomes easier after that.
Step 2: Learn Excel for Data Analysis
Time needed – 3 to 4 weeks
Excel is the best starting point for any beginner. Why? Because almost every company uses it – for sales tracking, financial reporting, performance monitoring, and daily operations. Learning Excel first helps you get comfortable with data tables, basic calculations, and simple reporting before moving to complex tools.
Excel Skills You Need to Learn
Do not try to learn everything at once. Focus on these topics only –
- Basic formulas and functions
- IF, SUMIF, COUNTIF and similar functions
- XLOOKUP and INDEX-MATCH
- Sorting and filtering data
- Pivot tables and pivot charts
- Data cleaning techniques
- Conditional formatting
- Power Query basics
Practical Project – Sales Performance Report
Once you learn the basics, build this project using a real sales dataset –
- Remove duplicate records from the data
- Find and fix missing values
- Calculate total sales figures
- Compare performance month by month
- Create a pivot table to summarise everything
- Prepare a simple management report
This one project will teach you more than hours of watching tutorials. You will see exactly how raw messy data becomes a clean and useful business report.
Quick Tip – Do not rush to the next tool before you are fully comfortable with Excel. If you cannot explain your Excel results in simple words – you are not ready yet. Take your time here.
Step 3: Master SQL and Database Fundamentals
Time needed – 4 to 6 weeks
Once you are comfortable with Excel, the next big skill you need is SQL. SQL stands for Structured Query Language. Do not let the technical name scare you. In simple words – SQL is how you talk to a database.
You use it to find data, filter it, combine it, and summarise it. Almost every company stores their data in databases and SQL is the only way to access it directly. If Excel works with hundreds of rows – SQL works with millions. That is the difference.
SQL Topics You Need to Learn
Take it step by step. Do not jump to advanced topics before basics are clear –
Beginner SQL –
- SELECT statements
- WHERE conditions
- ORDER BY
- DISTINCT
- LIMIT
- Basic aggregate functions like COUNT, SUM, AVG
Intermediate SQL –
- GROUP BY and HAVING
- INNER JOIN and LEFT JOIN
- CASE statements
- Subqueries
- Common Table Expressions – CTEs
Advanced SQL for Analysts –
- Window functions
- ROW_NUMBER and RANK
- LAG and LEAD functions
- Query optimisation basics
Practical Project – Customer Sales Analysis Using SQL
Do not just practice random queries. Use SQL to answer real business questions like –
- Which customers have the highest purchase value?
- What are the monthly sales trends?
- Which products are generating the most revenue?
- How many customers came back and made repeat purchases?
This kind of practice is exactly what companies test in data analyst interviews. So the more you practice answering business questions with SQL – the more confident you will feel.
Why SQL Actually Matters
Many beginners skip SQL or rush through it. That is a big mistake. SQL is not just another tool – it is the language of data. Every data analyst job you apply for will expect you to know SQL. The level required may vary from company to company but the basics are non-negotiable. Start simple. Practice daily. Build your speed. And focus on writing queries that answer real questions – not just memorising syntax.
Step 4: Learn Power BI for Data Visualisation

Time needed – 3 to 4 weeks
You have learned Excel and SQL. Now it is time to present your findings in a way that actually impresses people. This is where Power BI comes in. Power BI is one of the most popular data visualisation tools used by companies across India and worldwide. It helps you take raw data and turn it into beautiful interactive dashboards and reports that anyone – even non-technical managers – can understand at a glance.
Power BI Skills You Need to Learn
Focus on these topics step by step –
- Importing data from different sources
- Power Query for cleaning and transforming data
- Building data relationships and models
- DAX fundamentals – calculated columns and measures
- Designing clean and useful dashboards
- Adding filters and slicers for interactivity
- Publishing and sharing reports with your team
Practical Project – Business Performance Dashboard
Once you are comfortable with the basics, build this project – Create a complete Business Performance Dashboard that shows –
- Total revenue figures
- Monthly sales trends
- Top performing products
- Regional performance comparison
- Customer category analysis
This project will feel very close to real work you will do as a data analyst. It will also look great in your portfolio when you start applying for jobs.
What Makes a Really Good Dashboard?
Here is something most beginners get wrong – they add too many charts thinking it looks impressive. It does not.
A good dashboard is simple and purposeful. It should –
- Have one clear goal or purpose
- Use the right chart for the right data
- Show only the most important metrics
- Avoid unnecessary clutter and decoration
- Help the reader understand trends quickly
Remember – your job is not to show how many charts you can make. Your job is to help someone make a better business decision by looking at your dashboard. Keep that in mind every time you design one.
Step 5: Learn Statistics and Python for Data Analysis
Time needed — 4 to 6 weeks
Once you are comfortable with SQL and Power BI — it is time to add two more powerful skills to your toolkit: Statistics and Python. These skills are also important when understanding the relationship between data analytics and data science, particularly when working with larger datasets and more advanced analysis.
These two work really well together. Statistics helps you understand what the data is actually telling you. Python helps you clean it, analyse it, and visualise it quickly and efficiently.
Statistics Topics You Need to Learn
Do not worry about complex maths here. Just focus on these basics —
- Mean, median and mode
- Percentage and probability
- Standard deviation
- Correlation and causation
- Descriptive statistics
- Basic hypothesis testing
You do not need advanced mathematics at all. Just understand how these concepts help you make sense of real business data.
Python Skills You Need to Learn
Start with basic Python first before jumping into libraries —
- Variables and data types
- Conditional statements and loops
- Functions
- Lists and dictionaries
- Pandas — for data manipulation
- NumPy — for numerical computing
- Matplotlib — for creating charts and visualisations
Practical Project — Customer Data Analysis Using Python
Practice both statistics and Python together using a real customer dataset —
- Import a CSV file using Pandas
- Identify missing and duplicate values
- Calculate average customer spending
- Analyse different customer categories
- Create charts using Matplotlib
- Write a short summary of your findings
For example — calculate the average purchase value across different customer groups and compare their buying behaviour. That is exactly the kind of analysis real companies need daily.
Why Learn Statistics and Python Together?
Most courses teach these separately. But learning them together makes much more sense. Statistics tells you what questions to ask. Python gives you the tools to find the answers. When you combine both through real projects — everything clicks much faster and you start feeling like a proper data analyst. Start simple. Practice regularly. And keep building on your progress one dataset at a time.
Step 6: Develop Business and Communication Skills
Here is something most data analyst courses will never tell you – Technical skills alone will not get you far. Yes you need Excel, SQL, Power BI and Python. But companies also need someone who can talk to non-technical managers, understand what the business actually needs, and explain data findings in simple clear language.
If you cannot communicate your analysis properly – your work loses its value.
Important Soft Skills to Work On
- Problem solving
- Written communication
- Presentation skills
- Critical thinking
- Business understanding
- Requirement gathering
- Stakeholder communication
Real Example
Most beginners would say this in a meeting – “The conversion rate decreased by 8%.” That is technically correct. But it tells the manager nothing useful. A good data analyst would say – “The conversion rate dropped by 8% during this period. We need to dig deeper to understand whether this is coming from traffic sources, product performance, or a change in customer behaviour.” See the difference? The second answer shows that you understand the business, you are thinking beyond the numbers, and you are guiding the team toward the next step. That is exactly the kind of analyst every company wants to hire.
Step 7: Prepare for Data Analyst Jobs and Interviews
You have learned the skills. You have built the projects. Now it is time for the part that actually gets you hired. At this stage, it is also useful to understand factors that can influence data analyst salary, such as skills, experience, location, industry, and job responsibilities. Job preparation is not just about updating your resume. It is about presenting yourself as someone who is genuinely ready to solve real business problems.
Build a Resume That Actually Gets Noticed
Your resume should clearly show –
- Your technical skills – Excel, SQL, Power BI, Python
- Practical projects you have completed with real results
- Work experience if you have any relevant background
- Education and certifications
- Achievements backed by real numbers and facts
One important tip – do not just list your projects by name. Write what you actually did and what result your analysis produced. That makes a real difference.
Important Interview Topics to Prepare
Most data analyst interviews will test you on –
- Excel formulas and pivot tables
- SQL joins and aggregations
- Power BI dashboard design
- Data cleaning techniques
- Basic statistics concepts
- Business case studies
- Your own portfolio projects
Practice Explaining Your Projects Out Loud
This is where most candidates fail. They build good projects but cannot explain them confidently in an interview.
Prepare clear answers for questions like –
- Why did you choose this dataset?
- How did you handle missing or incorrect values?
- Why did you use this particular chart?
- What business problem did your analysis solve?
- What would you do differently if you did this project again?
Practice these answers using your own project experience. The more naturally you can talk about your work – the more confident you will sound in any interview.
Common Mistakes to Avoid When Learning Data Analytics
Most beginners struggle not because they are not smart – but because they go about learning the wrong way. Avoid these 5 common mistakes –
- Learning Too Many Tools at Once: Jumping between Excel, SQL, Python and Power BI together confuses you and builds nothing properly. Master one tool completely before moving to the next.
- Ignoring SQL: Many learners focus only on dashboards and skip SQL entirely. That is a big mistake. SQL is non-negotiable in almost every data analyst job interview.
- Watching Tutorials Without Practicing: Watching hours of videos feels productive but it is not enough. You only truly learn when you open a real dataset and try things yourself independently.
- Building Projects Without Understanding the Data: A good looking dashboard means nothing if you do not understand the data behind it. Always start every project with one clear business question in mind.
- Expecting a Job Immediately After Course Completion: Finishing a course does not mean you are job ready. Keep practicing, keep improving your portfolio, and keep applying while continuing to build your skills daily.
Conclusion
Becoming a data analyst does not happen overnight – and that is completely okay. Start simple. Learn Excel first. Then build your SQL skills. Add Power BI. Understand basic statistics. And gradually bring Python into your toolkit. One step at a time.
But here is the most important thing – do not just finish courses and move on. Spend real time working with datasets, building projects, and practicing how to explain your findings clearly. That hands-on experience is what actually prepares you for a real job. Knowledge without practice will only take you so far.
If you want structured guidance through this entire journey – DataSkillHub offers practical data analytics training covering Excel, Power BI, SQL, Python and real world projects. You can explore their curriculum and choose a learning path that matches your goals and timeline. Your data analytics career starts with one simple decision – pick up one skill today and start practicing. Everything else will follow from there.